Telemetry
The telemetry role allows users to set up iDRAC telemetry support and visualizations.
To initiate telemetry support, fill out the following parameters in omnia/input/telemetry_config.yml:
Name |
Description |
|---|---|
|
Enables iDRAC telemetry support and visualizations.
|
|
Enables slurm telemetry support and visualizations.
|
|
Postgres DB name with timescale extension is used for storing iDRAC and slurm telemetry metrics.
|
|
MySQL DB name used to store IPs and credentials of iDRACs having datacenter license
|
|
This is the timezone that will be set during provisioning of OS. Accepted values are listed in
|
|
Username used for to authenticate to timescale db. The username must not contain -,, ‘,”. The Length of the username should be at least 2 characters. |
|
Password used for to authenticate to timescale db. The username must not contain -,, ‘,”. The Length of the username should be at least 2 characters. |
|
Username used for to authenticate to mysql db. The username must not contain -,, ‘,”. The Length of the username should be at least 2 characters. |
|
Password used for to authenticate to mysql db. The username must not contain -,, ‘,”. The Length of the username should be at least 2 characters. |
|
Root password used for to authenticate to mysql db. The username must not contain -,, ‘,”. The Length of the username should be at least 2 characters. |
|
The username for iDRAC. The username must not contain -,, ‘,”. Required only if idrac_telemetry_support is true. |
|
The password for iDRAC. The username must not contain -,, ‘,”. Required only if idrac_telemetry_support is true. |
|
The username for grafana UI. The length of username should be at least 5. The username must not contain -,, ‘,”. |
|
The password for grafana UI. The length of username should be at least 5. The username must not contain -,, ‘,”. ‘admin’ is not an accepted value. |
|
Password of manager node. Required only if |
Once control_plane.yml and omnia.yml are executed, run the following commands from omnia/telemetry:
ansible-playbook telemetry.yml -i inventory
Note
The passed inventory should have 3 groups: idrac, manager, compute.
After initiation, new nodes can be added to telemetry by running the following commands from omnia/telemetry:
ansible-playbook add_idrac_node.yml -i inventory
Note
The passed inventory should have an idrac group.
telemetry_config.ymlis encrypted upon executingtelemetry.yml. To edit the file, useansible-vault edit telemetry_config.yml --vault-password-file .telemetry_vault_key.If
idrac_telemetryistruewhile executingtelemetry.yml, or while runningadd_idrac_node.yml, if the inventory passed does not contain an idrac group, idrac telemetry will run on IP’s present under/opt/omnia/provisioned_idrac_inventoryof control plane.
Viewing Performance Stats on Grafana
Using Texas Technical University data visualization lab, data polled from iDRAC and Slurm can be processed to generate live graphs. These Graphs can be accessed on the Grafana UI.
Once provision.yml is executed and Grafana is set up, use telemetry.yml to initiate the Graphs. Data polled via Slurm and iDRAC is streamed into internal databases. This data is processed to create the 4 graphs listed below.
Note
This feature only works on Nodes using iDRACs with a datacenter license running a minimum firmware of 4.0.
To access the grafana UI:
Find the IP address of the Grafana service using
kubectl get svc -n grafana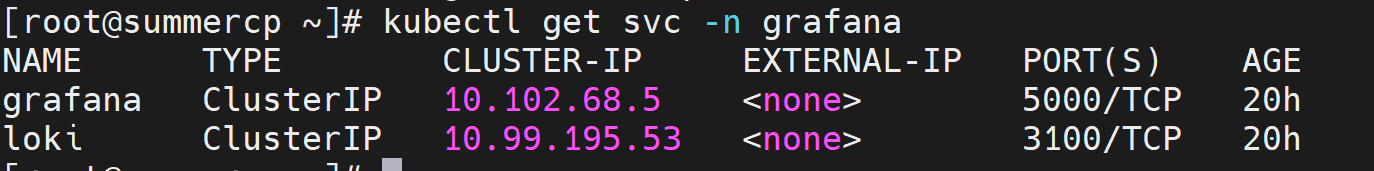
Login to the Grafana UI by connecting to the cluster IP of grafana service obtained above via port 5000. That is
http://xx.xx.xx.xx:5000/login
Enter the
grafana_usernameandgrafana_passwordas mentioned inmonitor/monitor_config.yml.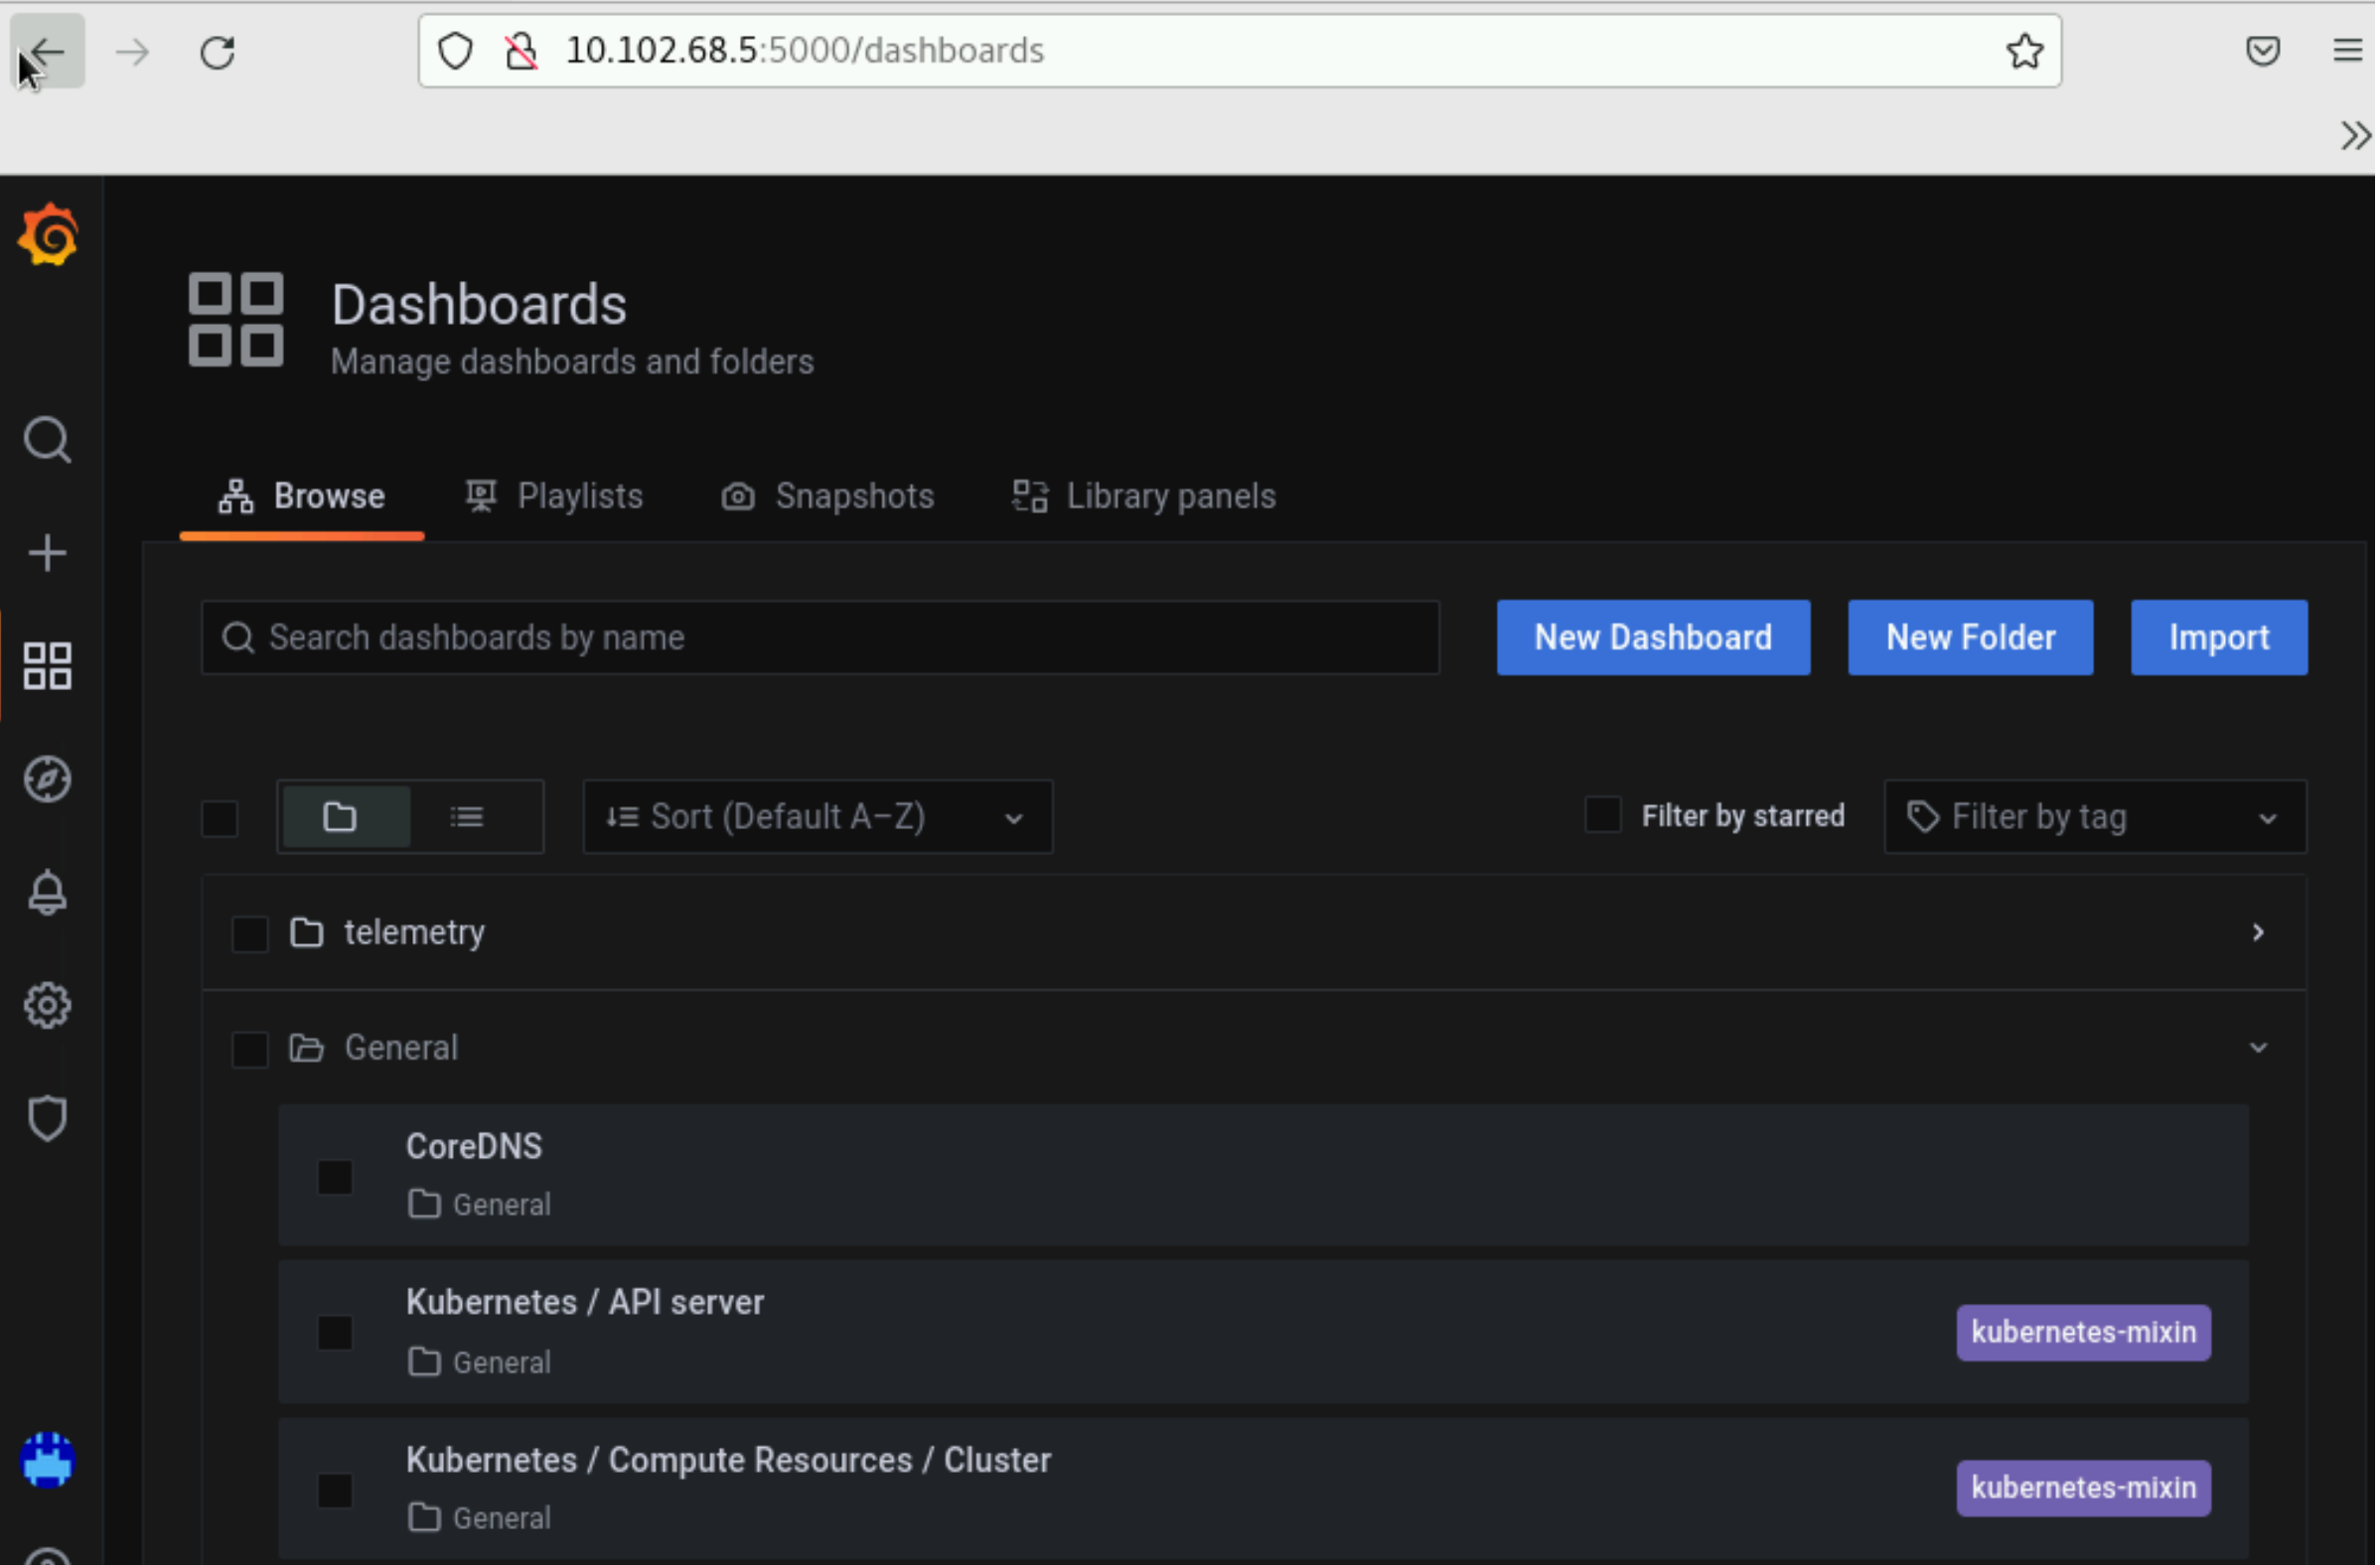
All your data in a glance:
Using the following graphs, data can be visualized to gather correlational information.
Note
The timestamps used for the time metric are based on the timezone set in input/provision_config.yml. In the event of a mismatch between the timezone on the browser being used to access Grafana UI and the timezone in input/provision_config.yml, the time range being used to filter information on the Grafana UI will have to be adjusted per the timezone in input/provision_config.yml.
If you have any feedback about Omnia documentation, please reach out at omnia.readme@dell.com.