Known issues
⦾ Why doesn’t my newly discovered server list a MAC ID in the cluster.nodeinfo table?
Due to internal MAC ID conflicts on the target nodes, the MAC address will be listed against the target node using this format MAC ADDRESS 1 | MAC ADDRESS 2! *NOIP* in the xCAT node object.

⦾ Why does the task Assign admin NIC IP fail during discovery_provision.yml with errors?
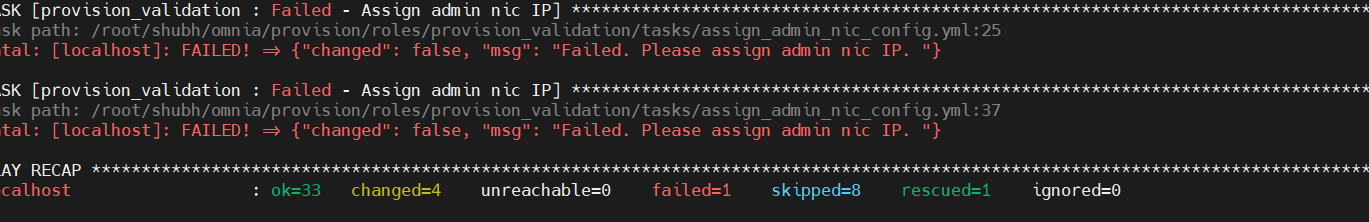
Potential Cause: Omnia validates the admin NIC IP on the control plane. If the user has not assigned an admin NIC IP in case of dedicated network interface type, an error message is returned. There is a parsing logic that is being applied on the blank IP and hence, the error displays twice.
Resolution: Ensure a control plane IP is assigned to the admin NIC.
⦾ Why are some target servers not reachable after PXE booting them?
Potential Causes:
The server hardware does not allow for auto rebooting
The process of PXE booting the node has stalled.
Resolution:
Login to the iDRAC console to check if the server is stuck in boot errors (F1 prompt message). If true, clear the hardware error or disable POST (PowerOn Self Test).
Hard-reboot the server to bring up the server and verify that the boot process runs smoothly. (If it gets stuck again, disable PXE and try provisioning the server via iDRAC.)
⦾ Why does the Task [infiniband_switch_config : Authentication failure response] fail with the message ‘Status code was -1 and not [302]: Request failed: <urlopen error [Errno 111] Connection refused>’ on Infiniband Switches when running infiniband_switch_config.yml?
To configure a new Infiniband Switch, HTTP and JSON gateway must be enabled. To verify that they are enabled, run:
To check if HTTP is enabled: show web
To check if JSON Gateway is enabled: show json-gw
To correct the issue, run:
To enable the HTTP gateway: web http enable
To enable the JSON gateway: json-gw enable
⦾ Why does PXE boot fail with tftp timeout or service timeout errors?
Potential Causes:
RAID is configured on the server.
Two or more servers in the same network have xCAT services running.
The target cluster node does not have a configured PXE device with an active NIC.
Resolution:
Create a Non-RAID or virtual disk on the server.
Check if other systems except for the control plane have xcatd running. If yes, then stop the xCAT service using the following commands:
systemctl stop xcatd.On the server, go to BIOS Setup -> Network Settings -> PXE Device. For each listed device (typically 4), configure an active NIC under
PXE device settings
⦾ Why does running local_repo.yml fail with connectivity errors?
Potential Cause: The control plane was unable to reach a required online resource due to a network glitch.
Resolution: Verify all connectivity and re-run the playbook.
⦾ Why does any script that installs software fail with “The checksum for <software repository path> did not match.”?
Potential Cause: A local repository for the software was not configured by local_repo.yml.
Resolution:
Delete the tarball/image/deb of the software from
<repo_path>/cluster/tarball.Re-run
local_repo.yml.Re-run the script to install the software.
⦾ Why do Kubernetes Pods show “ImagePullBack” or “ErrPullImage” errors in their status?
Potential Cause:
The errors occur when the Docker pull limit is exceeded.
Resolution:
Ensure that the
docker_usernameanddocker_passwordare provided ininput/provision_config_credentials.yml.For a HPC cluster, during
omnia.ymlexecution, a kubernetes secret ‘dockerregcred’ will be created in default namespace and patched to service account. User needs to patch this secret in their respective namespace while deploying custom applications and use the secret as imagePullSecrets in yaml file to avoid ErrImagePull. Click here for more info.
Note
If the playbook is already executed and the pods are in ImagePullBack state, then run kubeadm reset -f in all the nodes before re-executing the playbook with the docker credentials.
⦾ Why does the task ‘Gather facts from all the nodes’ get stuck when re-running ``omnia.yml``?
Potential Cause: Corrupted entries in the /root/.ansible/cp/ folder. For more information on this issue, check this out!
Resolution: Clear the directory /root/.ansible/cp/ using the following commands:
cd /root/.ansible/cp/

rm -rf *
Alternatively, run the task manually:
cd omnia/utils/cluster
ansible-playbook gather_facts_resolution.yml
⦾ What to do if the nodes in a Kubernetes cluster reboot:
Wait for 15 minutes after the Kubernetes cluster reboots. Next, verify the status of the cluster using the following commands:
kubectl get nodeson the kube_control_plane to get the real-time k8s cluster status.kubectl get pods all-namespaceson the kube_control_plane to check which the pods are in the Running state.kubectl cluster-infoon the kube_control_plane to verify that both the k8s master and kubeDNS are in the Running state.
⦾ What to do when the Kubernetes services are not in the Running state:
Run
kubectl get pods all-namespacesto verify that all pods are in the Running state.If the pods are not in the Running state, delete the pods using the command:
kubectl delete pods <name of pod>Run the corresponding playbook that was used to install Kubernetes:
omnia.yml,jupyterhub.yml, orkubeflow.yml.
⦾ Why do Kubernetes Pods stop communicating with the servers when the DNS servers are not responding?
Potential Cause: The host network is faulty causing DNS to be unresponsive
Resolution:
In your Kubernetes cluster, run
kubeadm reset -fon all the nodes.On the management node, edit the
omnia_config.ymlfile to change the Kubernetes Pod Network CIDR. The suggested IP range is 192.168.0.0/16. Ensure that the IP provided is not in use on your host network.List k8s in
input/software_config.jsonand re-runomnia.yml.
⦾ What to do if pulling the Kserve inference model fail with “Unable to fetch image “kserve/sklearnserver:v0.11.2”: failed to resolve image to digest: Get “https://index.docker.io/v2/”: dial tcp 3.219.239.5:443: i/o timeout.”?
Edit the kubernetes configuration map:
kubectl edit configmap -n knative-serving config-deployment
Add docker.io and index.docker.io as part of the registries-skipping-tag-resolving.
For more information, click here.
⦾ Why does the ‘Initialize Kubeadm’ task fail with ‘nnode.Registration.name: Invalid value: "<Host name>"’?
Potential Cause: The control_plane playbook does not support hostnames with an underscore in it such as ‘mgmt_station’.
As defined in RFC 822, the only legal characters are the following: 1. Alphanumeric (a-z and 0-9): Both uppercase and lowercase letters are acceptable, and the hostname is not case-sensitive. In other words, omnia.test is identical to OMNIA.TEST and Omnia.test.
Hyphen (-): Neither the first nor the last character in a hostname field should be a hyphen.
Period (.): The period should be used only to delimit fields in a hostname (For example, dvader.empire.gov)
⦾ What to do when Kubeflow pods are in ‘ImagePullBackOff’ or ‘ErrImagePull’ status after executing kubeflow.yml?
Potential Cause: Your Docker pull limit has been exceeded. For more information, click here.
Delete Kubeflow deployment by executing the following command in kube_control_plane:
kfctl delete -V -f /root/k8s/omnia-kubeflow/kfctl_k8s_istio.v1.0.2.yamlRe-execute
kubeflow.ymlafter 8-9 hours
⦾ What to do when omnia.yml fails while completing the security role, and returns the following error message: ‘Error: kinit: Connection refused while getting default cache’?
Start the sssd-kcm.socket:
systemctl start sssd-kcm.socketRe-run
omnia.yml
⦾ What to do when Slurm services do not start automatically after the cluster reboots:
Manually restart the slurmd services on the kube_control_plane by running the following commands:
systemctl restart slurmdbd
systemctl restart slurmctld
systemctl restart prometheus-slurm-exporter
Run
systemctl status slurmdto manually restart the following service on all the cluster nodes.
⦾ Why do Slurm services fail?
Potential Cause: The slurm.conf is not configured properly.
Recommended Actions:
Run the following commands:
slurmdbd -Dvvv
slurmctld -Dvvv
Refer the
/var/lib/log/slurmctld.logfile for more information.
⦾ What causes the “Ports are Unavailable” error?
Potential Cause: Slurm database connection fails.
Recommended Actions:
Run the following commands::
slurmdbd -Dvvv
slurmctld -Dvvv
Refer the
/var/lib/log/slurmctld.logfile.Check the output of
netstat -antp | grep LISTENfor PIDs in the listening state.If PIDs are in the Listening state, kill the processes of that specific port.
Restart all Slurm services:
slurmctl restart slurmctld on slurm_control_node

systemctl restart slurmdbd on slurm_control_node

systemctl restart slurmd on slurm_node
⦾ Why does the task ‘nfs_client: Mount NFS client’ fail with ``Failed to mount NFS client. Make sure NFS Server is running on IP xx.xx.xx.xx``?
Potential Cause:
The required services for NFS may not have been running:
nfs
rpc-bind
mountd
Resolution:
Enable the required services using
firewall-cmd --permanent --add-service=<service name>and then reload the firewall usingfirewall-cmd --reload.
⦾ What to do when omnia.yml execution fails with nfs-server.service might not be running on NFS Server. Please check or start services``?
Potential Cause: nfs-server.service is not running on the target node.
Resolution: Use the following commands to bring up the service:
systemctl start nfs-server.service

systemctl enable nfs-server.service
⦾ Why does the task `configure registry: Start and enable nerdctl-registry service` fail with “Job for nerdctl-registry.service failed because the control process exited with error code”?
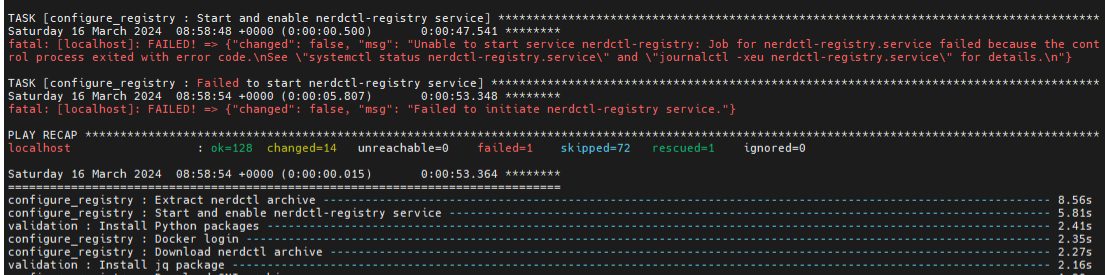
Potential Cause:
The subnet 10.4.0.0/24 has been assigned to the admin, bmc, or additional network. nerdctl uses this subnet by default and cannot be assigned to any other interface in the system.
The docker pull limit has been breached.
Resolution:
Reassign the conflicting network to a different subnet.
Update
input/provision_config_credentials.ymlwith thedocker_usernameanddocker_password.
⦾ Why does the task ‘Install Packages’ fail on the NFS node with the message: ``Failure in talking to yum: Cannot find a valid baseurl for repo: base/7/x86_64.``
Potential Cause:
There are connections missing on the NFS node.
Resolution:
Ensure that there are 3 NICs being used on the NFS node:
For provisioning the OS
For connecting to the internet (Management purposes)
For connecting to PowerVault (Data Connection)
⦾ What to do when the JupyterHub or Prometheus UI is not accessible:
Run the command kubectl get pods namespace default to ensure nfs-client pod and all Prometheus server pods are in the Running state.
⦾ What to do if PowerVault throws the error: ``Error: The specified disk is not available. - Unavailable disk (0.x) in disk range ‘0.x-x’``:
Verify that the disk in question is not part of any pool using:
show disksIf the disk is part of a pool, remove it and try again.
⦾ Why does PowerVault throw the error: ``You cannot create a linear disk group when a virtual disk group exists on the system.``?
At any given time only one type of disk group can be created on the system. That is, all disk groups on the system have to exclusively be linear or virtual. To fix the issue, either delete the existing disk group or change the type of pool you are creating.
⦾ Why does the task ‘nfs_client: Mount NFS client’ fail with the message ``No route to host``?
Potential Cause:
There’s a mismatch in the share path listed in
/etc/exportsand inomnia_config.ymlundernfs_client_params.
Resolution:
Ensure that the input paths are a perfect match to avoid any errors.
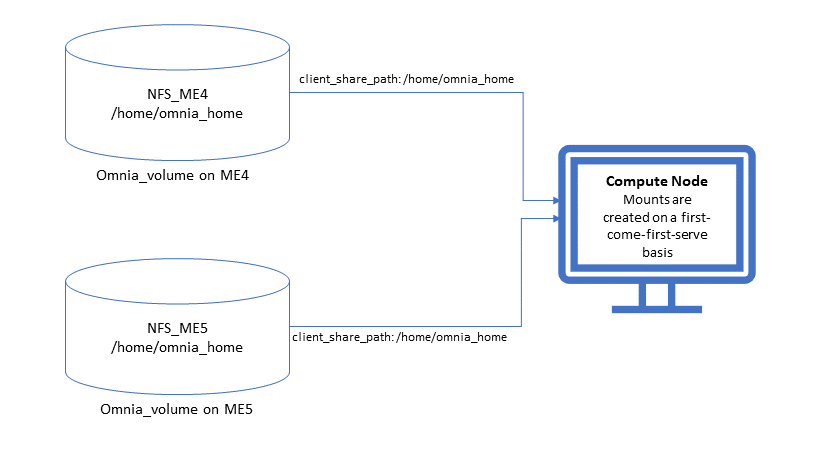
⦾ Why is my NFS mount not visible on the client?
Potential Cause: The directory being used by the client as a mount point is already in use by a different NFS export.
Resolution: Verify that the directory being used as a mount point is empty by using cd <client share path> | ls or mount | grep <client share path>. If empty, re-run the playbook.
⦾ Why does the ``BeeGFS-client`` service fail?
Potential Causes:
SELINUX may be enabled. (use
sestatusto diagnose the issue)Ports 8008, 8003, 8004, 8005 and 8006 may be closed. (use
systemctl status beegfs-mgmtd, systemctl status beegfs-meta, systemctl status beegfs-storageto diagnose the issue)The BeeGFS set up may be incompatible with RHEL.
Resolution:
If SELinux is enabled, update the file
/etc/sysconfig/selinuxand reboot the server.Open all ports required by BeeGFS: 8008, 8003, 8004, 8005 and 8006
Check the support matrix for RHEL or Rocky to verify your set-up.
For further insight into the issue, check out
/var/log/beegfs-client.logon nodes where the BeeGFS client is running.
⦾ Why does the task ‘security: Authenticate as admin’ fail?
Potential Cause: The required services are not running on the node. Verify the service status using:
systemctl status sssd-kcm.socket

systemctl status sssd.service
Resolution:
Restart the services using:
systemctl start sssd-kcm.socket
systemctl start sssd.service
Re-run
omnia.ymlusing:ansible-playbook omnia.yml
⦾ Why would FreeIPA server/client installation fail? (version 1.5 and below)
Potential Cause:
The hostnames of the auth server nodes are not configured in the correct format.
Resolution:
If you have enabled the option to install the login node in the cluster, set the hostnames of the nodes in the format: hostname.domainname. For example, authserver_node.omnia.test is a valid hostname for the auth server node.
Note
To find the cause for the failure of the FreeIPA server and client installation, see ipaserver-install.log in the auth server.
⦾ What to do when JupyterHub pods are in ‘ImagePullBackOff’ or ‘ErrImagePull’ status after executing jupyterhub.yml:
Potential Cause: Your Docker pull limit has been exceeded. For more information, click here.
Delete Jupyterhub deployment by executing the following command in kube_control_plane:
helm delete jupyterhub -n jupyterhubRe-execute
jupyterhub.ymlafter 8-9 hours.
⦾ What to do if NFS clients are unable to access the share after an NFS server reboot?
Reboot the NFS server (external to the cluster) to bring up the services again:
systemctl disable nfs-server
systemctl enable nfs-server
systemctl restart nfs-server
⦾ Why do Kuberneteschildnode & kubernetesnodes log as Pass in the database even if there are nodes in the Ready,Schedulingdisabled state?
Potential Cause: Omnia telemetry considers Ready,SchedulingDisabled as a Ready state of Kubernetes nodes . So, even if the kubectl get nodes command shows any node’s state as Ready,SchedulingDisabled, the entry in DB for Kuberneteschildnode & kubernetesnodes will be logged as Pass instead of Fail.
If you have any feedback about Omnia documentation, please reach out at omnia.readme@dell.com.