Control plane logs
All log files can be viewed using CLI. Alternatively, most log files can be viewed using the Dashboard tab (  ) on the grafana UI.
Caution
It is not recommended to delete the below log files or the directories they reside in.
Note
Log files are rotated periodically as a storage consideration. To customize how often logs are rotated, edit the /etc/logrotate.conf file on the node.
Below is a list of all logs available to Loki and can be accessed from the dashboard:
Name |
Location |
Purpose |
Additional Information |
|---|---|---|---|
Omnia Logs |
/var/log/omnia.log |
Omnia Log |
This log is configured by Default. This log can be used to track all changes made by all playbooks in the omnia directory. |
Accelerator Logs |
/var/log/omnia/accelerator.log |
Accelerator Log |
This log is configured by Default. |
Monitor Logs |
/var/log/omnia/monitor.log |
Monitor Log |
This log is configured by Default. |
Network Logs |
/var/log/omnia/network.log |
Network Log |
This log is configured by Default. |
Platform Logs |
/var/log/omnia/platforms.log |
Platform Log |
This log is configured by Default. |
Provision Logs |
/var/log/omnia/provision.log |
Provision Log |
This log is configured by Default. |
Scheduler Logs |
/var/log/omnia/scheduler.log |
Scheduler Log |
This log is configured by Default. |
Security Logs |
/var/log/omnia/security.log |
Security Log |
This log is configured by Default. |
Storage Logs |
/var/log/omnia/storage.log |
Storage Log |
This log is configured by Default. |
Telemetry Logs |
/var/log/omnia/telemetry.log |
Telemetry Log |
This log is configured by Default. |
Utils Logs |
/var/log/omnia/utils.log |
Utils Log |
This log is configured by Default. |
Cluster Utilities Logs |
/var/log/omnia/utils_cluster.log |
Cluster Utils Log |
This log is configured by Default. |
syslogs |
/var/log/messages |
System Logging |
This log is configured by Default. |
Audit Logs |
/var/log/audit/audit.log |
All Login Attempts |
This log is configured by Default. |
CRON logs |
/var/log/cron |
CRON Job Logging |
This log is configured by Default. |
Pods logs |
/var/log/pods/ * / * / * log |
k8s pods |
This log is configured by Default. |
Access Logs |
/var/log/dirsrv/slapd-<Realm Name>/access |
Directory Server Utilization |
This log is available when FreeIPA or 389ds is set up ( ie when enable_security_support is set to ‘true’). |
Error Log |
/var/log/dirsrv/slapd-<Realm Name>/errors |
Directory Server Errors |
This log is available when FreeIPA or 389ds is set up ( ie when enable_security_support is set to ‘true’). |
CA Transaction Log |
/var/log/pki/pki-tomcat/ca/transactions |
FreeIPA PKI Transactions |
This log is available when FreeIPA or 389ds is set up ( ie when enable_security_support is set to ‘true’). |
KRB5KDC |
/var/log/krb5kdc.log |
KDC Utilization |
This log is available when FreeIPA or 389ds is set up ( ie when enable_security_support is set to ‘true’). |
Secure logs |
/var/log/secure |
Login Error Codes |
This log is available when FreeIPA or 389ds is set up ( ie when enable_security_support is set to ‘true’). |
HTTPD logs |
/var/log/httpd/ * |
FreeIPA API Calls |
This log is available when FreeIPA or 389ds is set up ( ie when enable_security_support is set to ‘true’). |
DNF logs |
/var/log/dnf.log |
Installation Logs |
This log is configured on Rocky OS. |
BeeGFS Logs |
/var/log/beegfs-client.log |
BeeGFS Logs |
This log is configured on BeeGFS client nodes. |
Compute Logs |
/var/log/xcat/computes.log |
Logs system messages from all cluster nodes. |
This log is configured by Default. |
Cluster deployment logs |
/var/log/xcat/cluster.log |
Logs deployment messages from all cluster nodes. |
This log is configured by Default. |
Logs of individual containers
A list of namespaces and their corresponding pods can be obtained using:
kubectl get pods -AGet a list of containers for the pod in question using:
kubectl get pods <pod_name> -o jsonpath='{.spec.containers[*].name}'Once you have the namespace, pod and container names, run the below command to get the required logs:
kubectl logs pod <pod_name> -n <namespace> -c <container_name>
Provisioning logs
Logs pertaining to actions taken during discovery_provision.yml can be viewed in /var/log/xcat/cluster.log and /var/log/xcat/computes.log on the control plane.
Note
As long as a node has been added to a cluster by Omnia, deployment events taking place on the node will be updated in /var/log/xcat/cluster.log.
Telemetry logs
Logs pertaining to actions taken by Omnia or iDRAC telemetry can be viewed in /var/log/messages. Each log entry is tagged “omnia_telemetry”. Log entries typically follow this format.
<Date time> <Node name> omnia_telemetry[<Process ID>]: <name of file>:<name of method throwing error>: <Error message>
Grafana Loki
After telemetry.yml is run, Grafana services are installed on the control plane.
Get the Grafana IP using
kubectl get svc -n grafana.Login to the Grafana UI by connecting to the cluster IP of grafana service via port 5000. That is
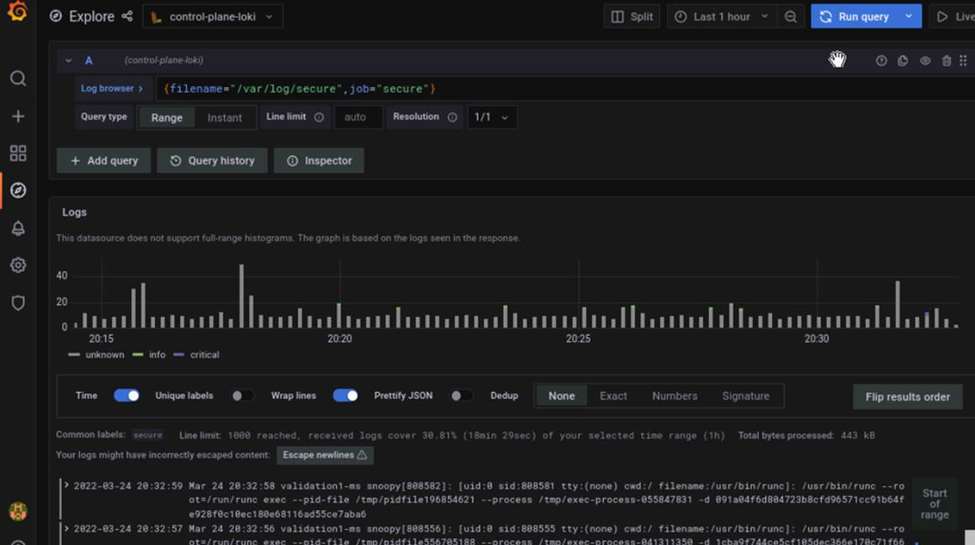
http://xx.xx.xx.xx:5000/login.In the Explore page, select control-plane-loki.
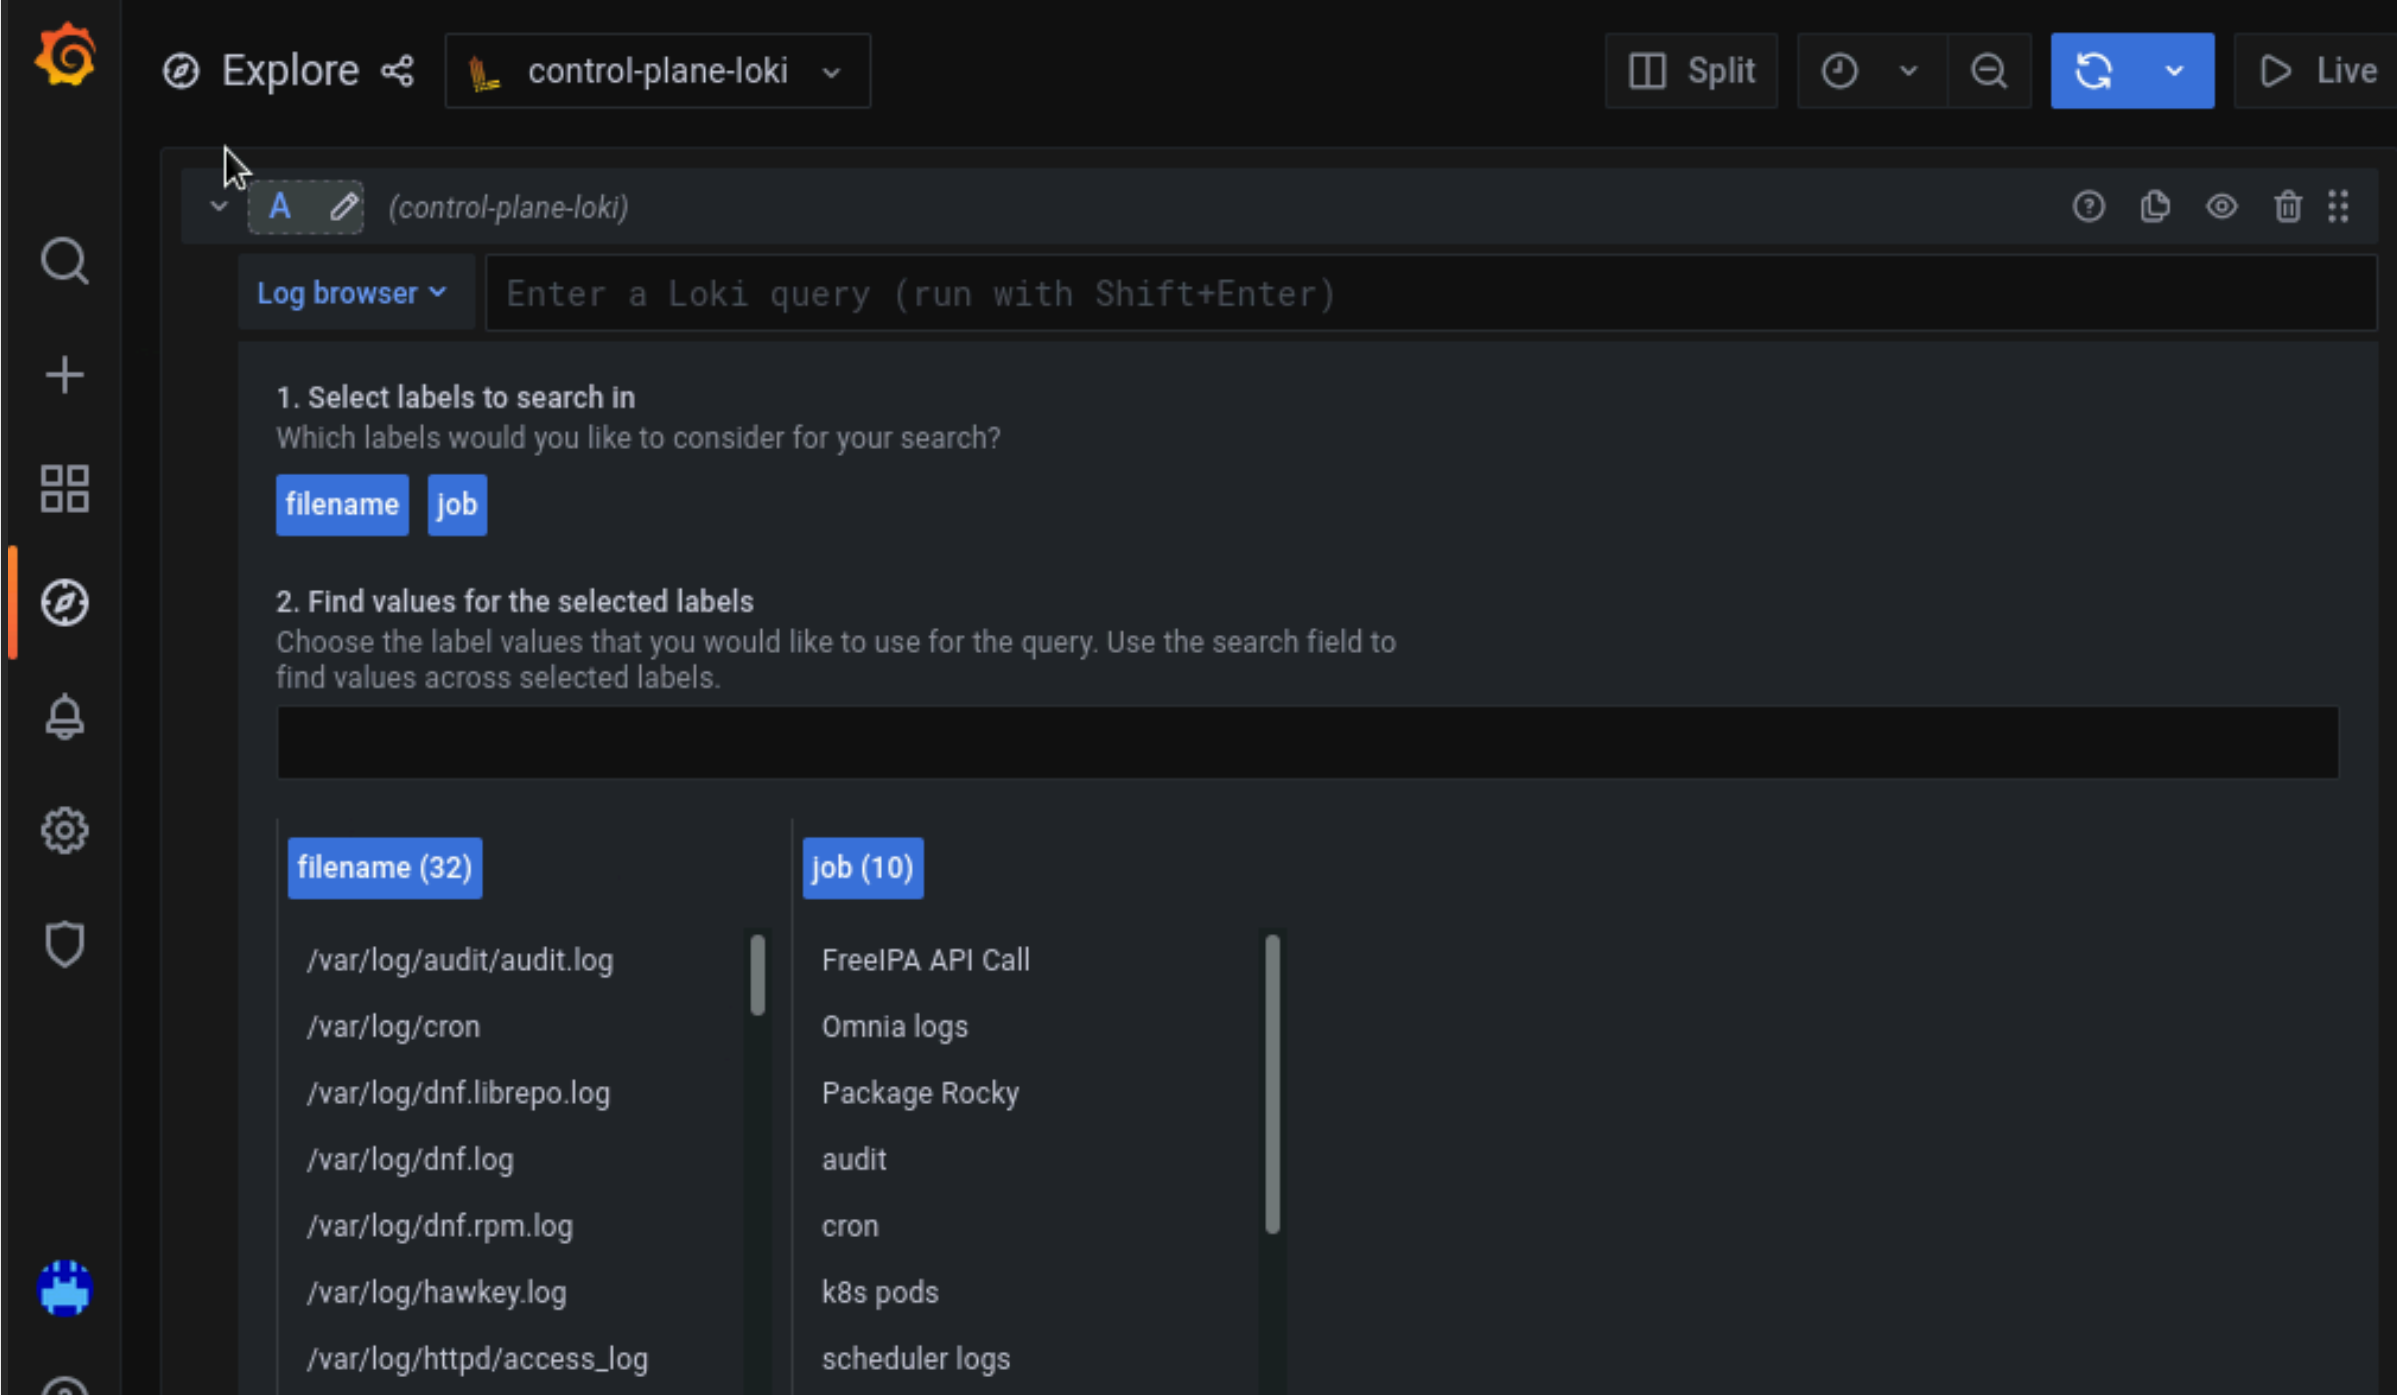
The log browser allows users to filter logs by job, node, user, etc. Example
(job= "cluster deployment logs") |= "nodename"
(job="compute log messages") |= "nodename" |="node_username"
Custom dashboards can be created as per your requirement.
If you have any feedback about Omnia documentation, please reach out at omnia.readme@dell.com.