Telemetry and visualizations
The telemetry feature allows the set up of Omnia telemetry (to poll values from all Omnia provisioned nodes in the cluster) and/or iDRAC telemetry (To poll values from all eligible iDRACs in the cluster). It also installs Grafana and Loki as Kubernetes pods.
To initiate telemetry support, fill out the following parameters in input/telemetry_config.yml:
Parameter |
Details |
|---|---|
idrac_telemetry_support
Required |
* * Note When |
omnia_telemetry_support
Required |
* * |
visualization_support
Required |
* * Note When |
appliance_k8s_pod_net_cidr
Required |
|
pod_external_ip_start_range
Required |
Note Make sure the IP range is not assigned to any node in the cluster.
|
pod_external_ip_end_range
Required |
Note Make sure the IP range is not assigned to any node in the cluster.
|
timescaledb_user
Required |
|
timescaledb_password
Required |
|
idrac_username
Optional |
|
idrac_password
Optional |
|
mysqldb_user
Optional |
|
mysqldb_password
Optional |
|
mysqldb_root_password
Optional |
|
omnia_telemetry_collection_interval
Required |
|
collect_regular_metrics
Required |
* * |
collect_health_check_metrics
Required |
* * |
collect_gpu_metrics
Required |
* * |
fuzzy_offset
Required |
|
metric_collection_timeout
Required |
|
grafana_username
Optional |
|
grafana_password
Optional |
|
mount_location
Optional |
|
Once you have executed discovery_provision.yml and has also provisioned the cluster, initiate telemetry on the cluster as part of omnia.yml, which configures the cluster with scheduler, storage and authentication using the below command.
ansible-playbook omnia.yml -i inventory
Optionally, you can initiate only telemetry using the below command:
ansible-playbook telemetry.yml -i inventory
Note
Depending on the type of telemetry initiated, include the following groups in the inventory:
omnia_telemetry: manager, compute, [optional] login
idrac_telemetry: idrac
If you would like a local backup of the timescaleDB used to store telemetry data, click here.
After initiation, new iDRACs can be added for idrac_telemetry acquisition by running the following commands:
ansible-playbook add_idrac_node.yml -i inventory
Modifying telemetry information
To modify how data is collected from the cluster, modify the variables in omnia/input/telemetry_config.yml and re-run the telemetry.yml playbook.
When
omnia_telemetry_supportis set to false, Omnia Telemetry Acquisition service will be stopped on all cluster nodes provided in the passed inventory.When
omnia_telemetry_supportis set to true, Omnia Telemetry Acquisition service will be restarted on all cluster nodes provided in the passed inventory.To start or stop the collection of regular metrics, health check metrics, or GPU metrics, update the values of
collect_regular_metrics,collect_health_check_metrics, orcollect_gpu_metrics. For a list of all metrics collected, click here.
Note
Currently, changing the
grafana_usernameandgrafana_passwordvalues is not supported viatelemetry.yml.The passed inventory should have an idrac group, if
idrac_telemetry_supportis true.If
omnia_telemetry_supportis true, then the inventory should have control plane and cluster node groups (as specified in the sample files) along with optional login group.Rocky 8.7 is not compatible with the Kubernetes installed by
telemetry.ymldue to known issues with cri-o. For more information, click here.If a subsequent run of
telemetry.ymlfails, thetelemetry_config.ymlfile will be unencrypted.
To access the Grafana UI
Pre requisites
visualisation_supportshould be set to true when runningtelemetry.ymloromnia.yml.
Find the IP address of the Grafana service using
kubectl get svc -n grafana

Login to the Grafana UI by connecting to the cluster IP of grafana service obtained above via port 5000. That is
http://xx.xx.xx.xx:5000/login
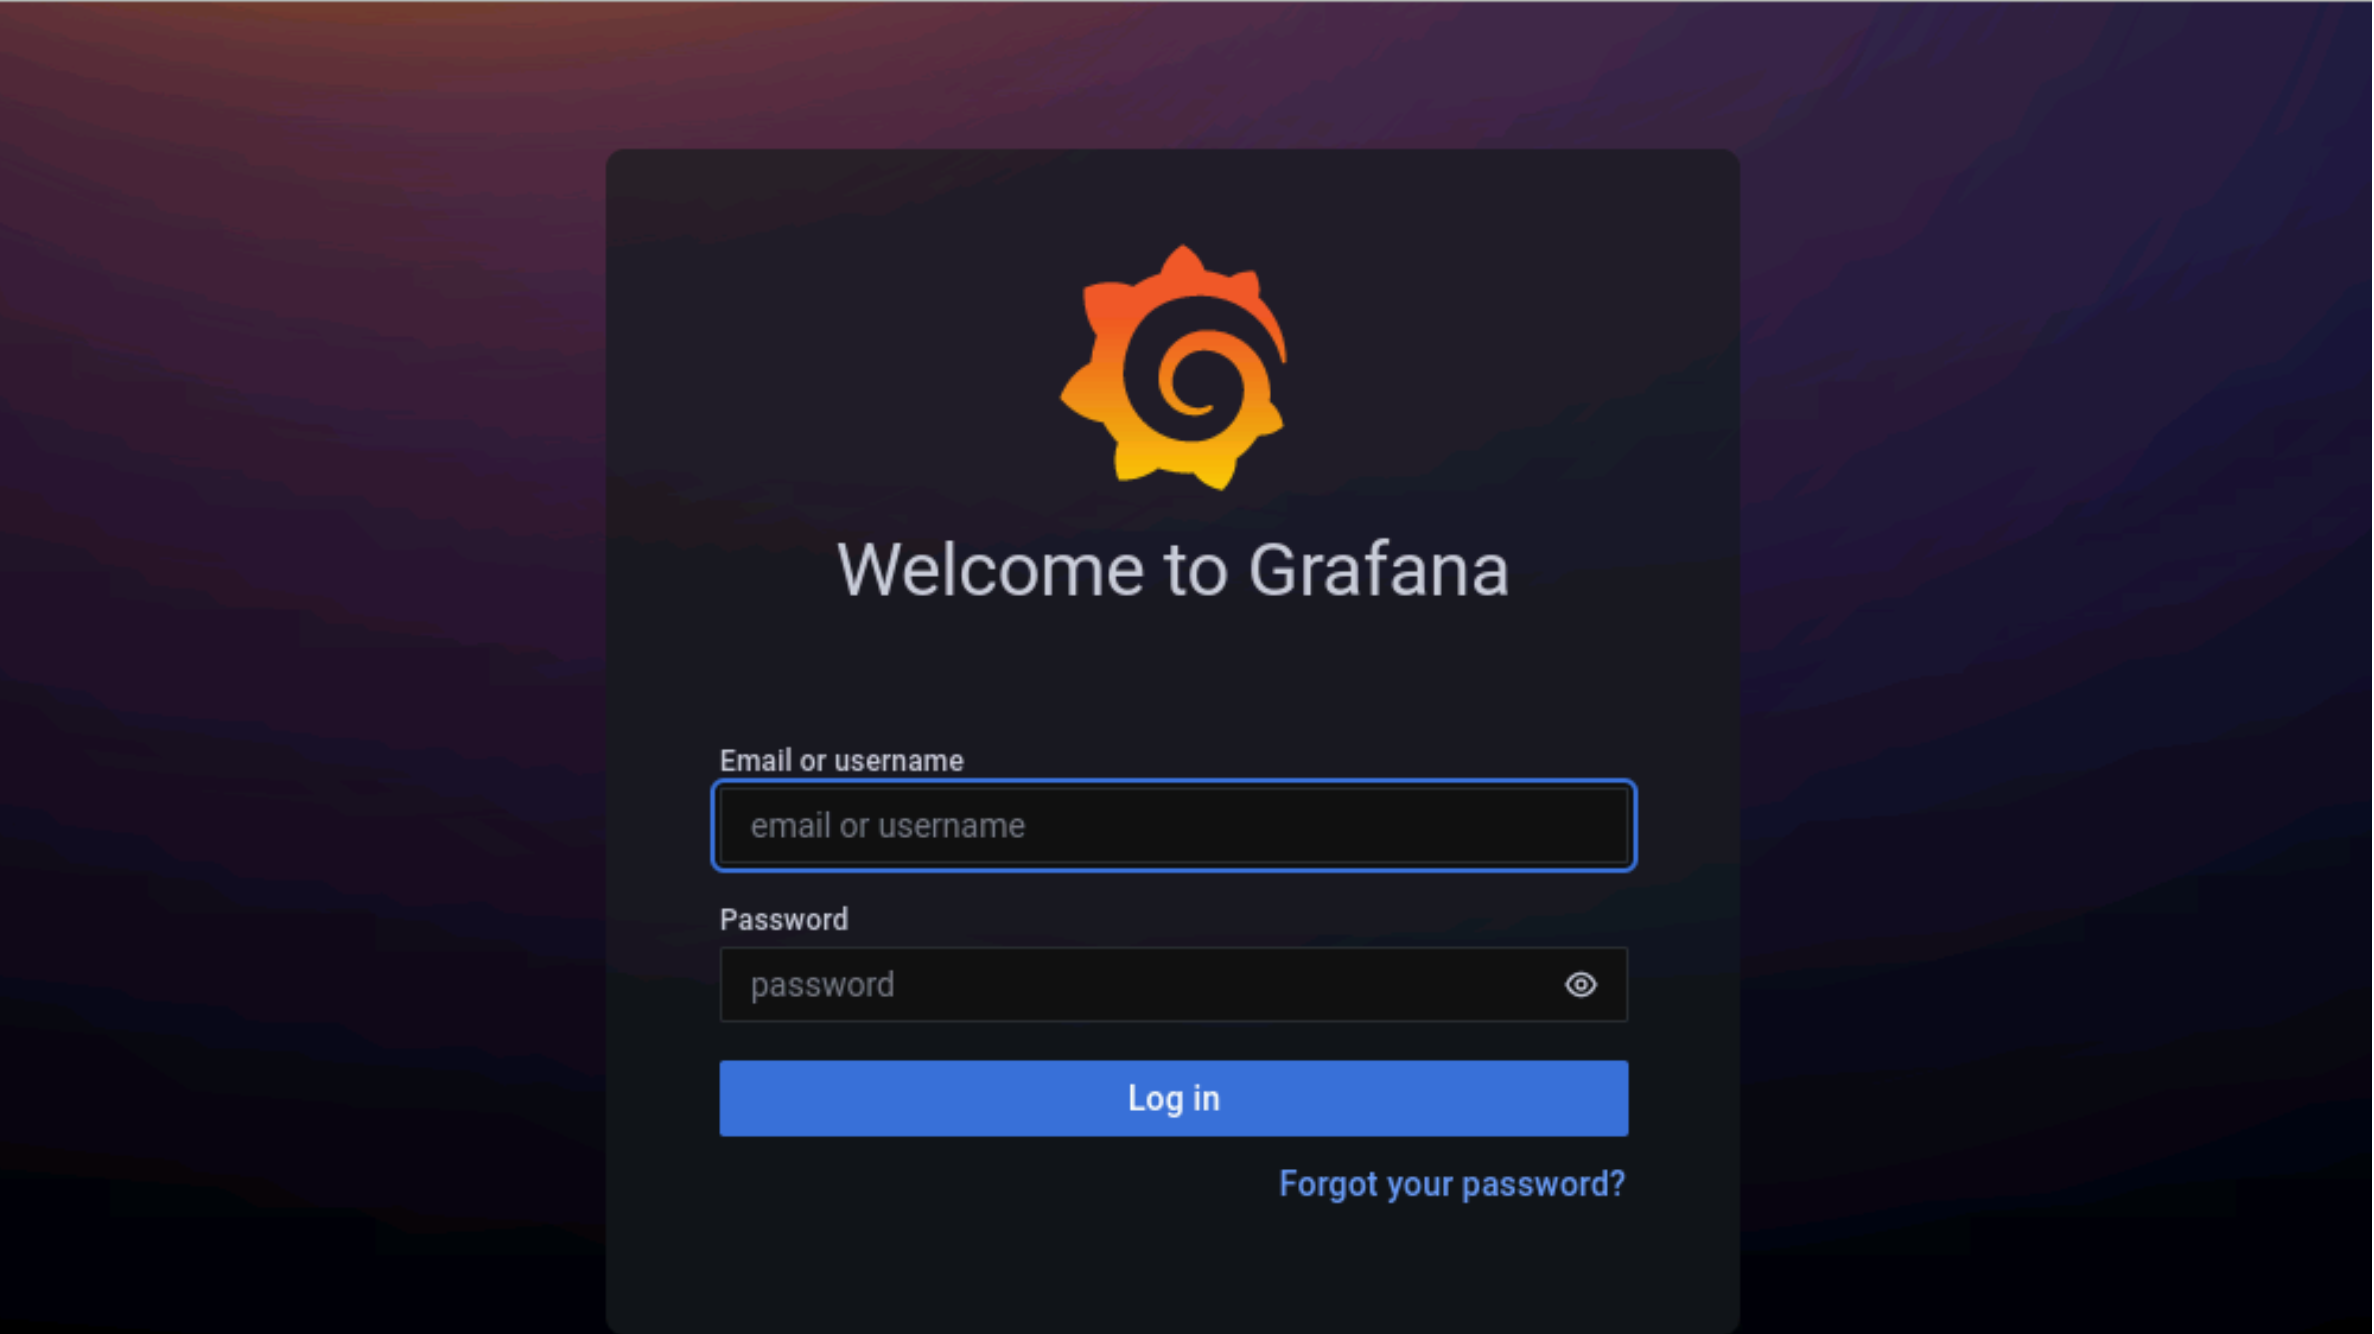
Enter the
grafana_usernameandgrafana_passwordas mentioned ininput/telemetry_config.yml.
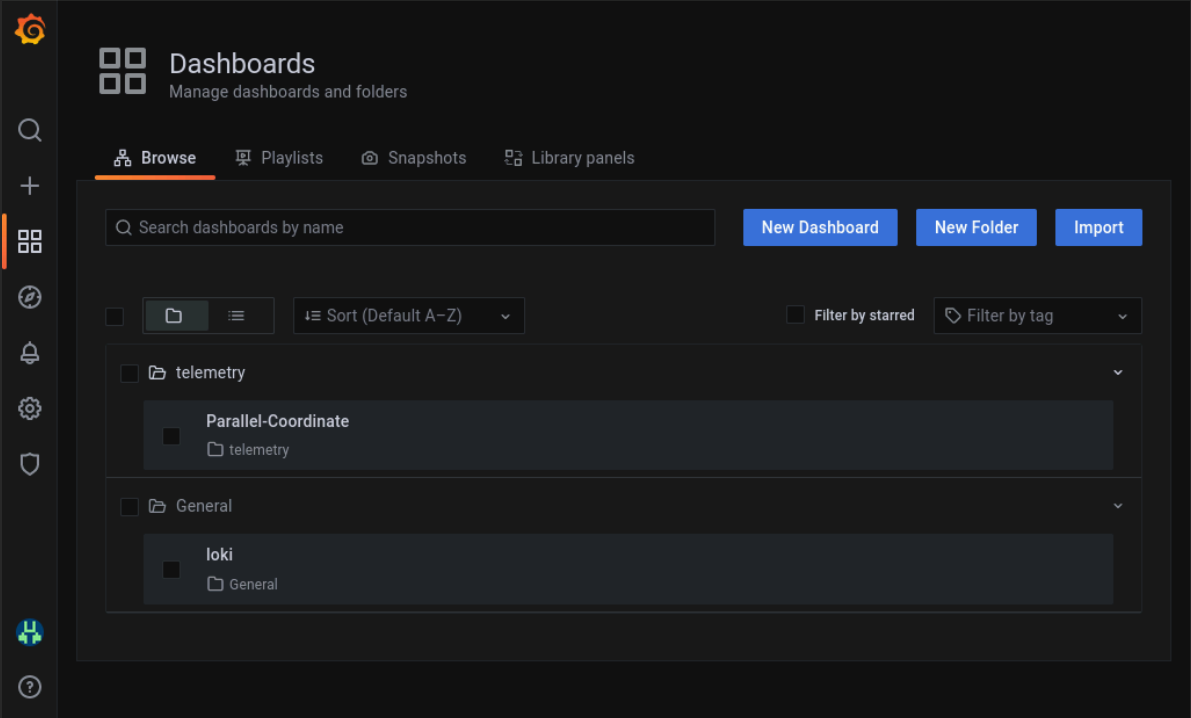
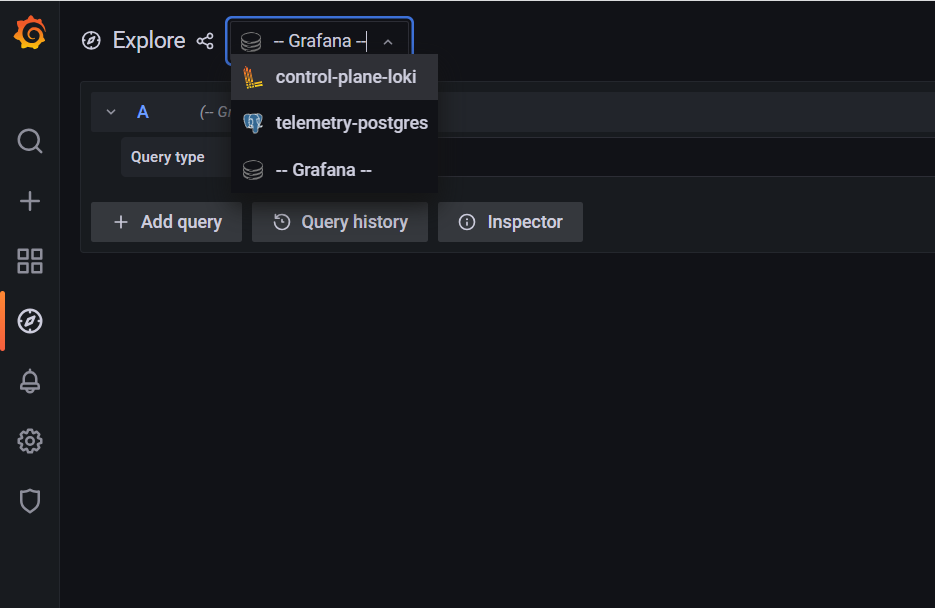
Loki log collections can viewed on the explore section of the grafana UI.
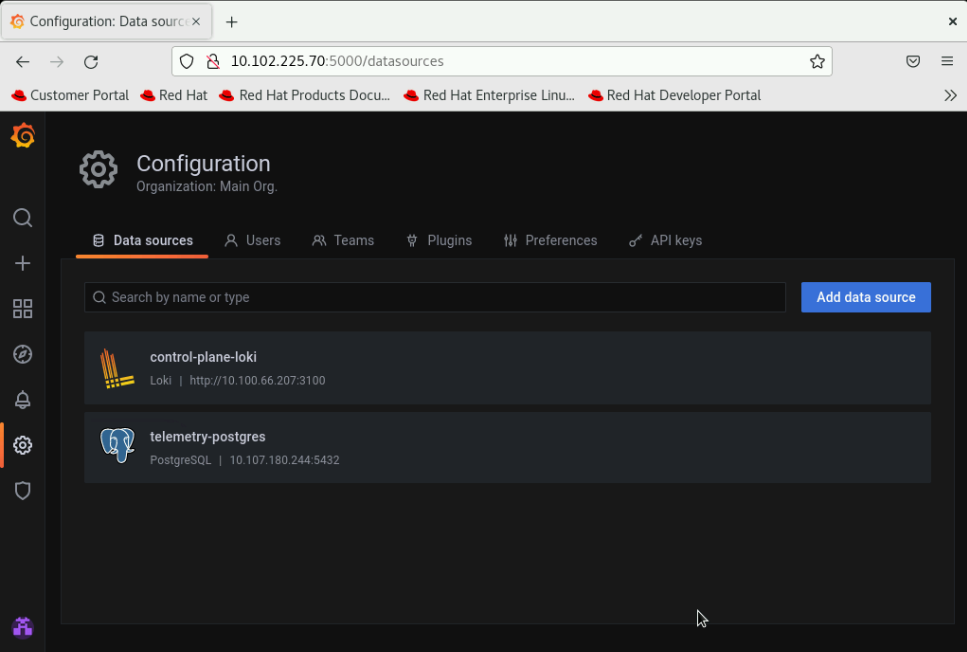
Datasources configured by Omnia can be viewed as seen below.
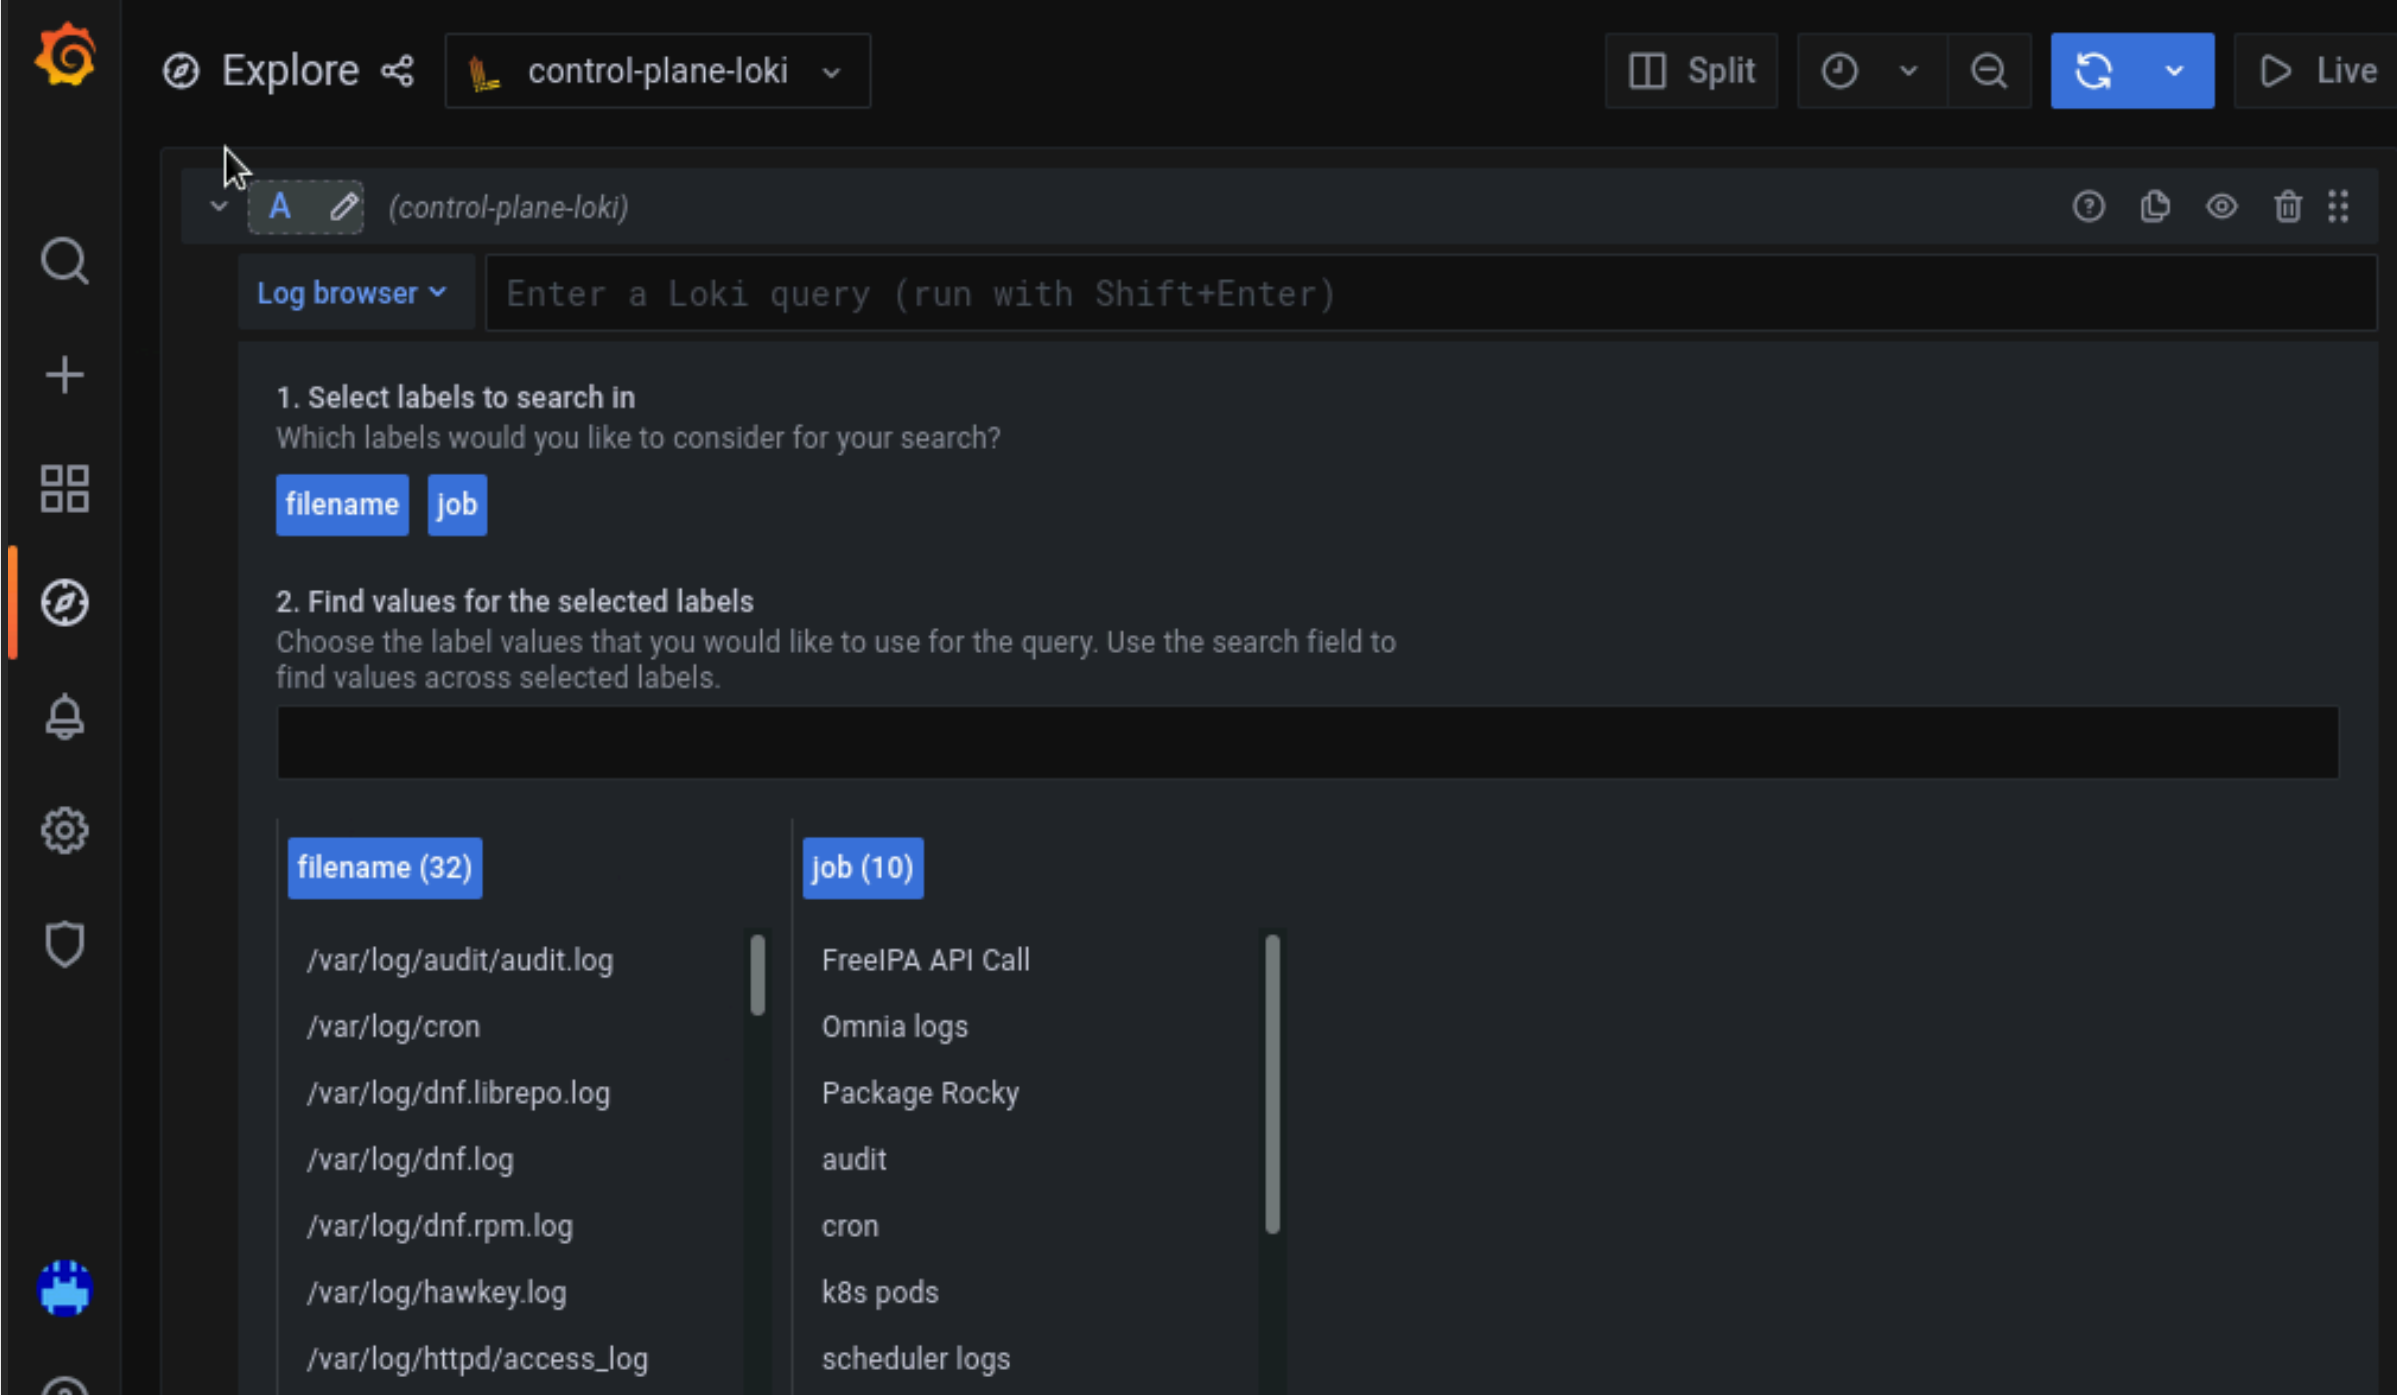
To use Loki for log filtering
Login to the Grafana UI by connecting to the cluster IP of grafana service obtained above via port 5000. That is
http://xx.xx.xx.xx:5000/loginIn the Explore page, select control-plane-loki.
The log browser allows you to filter logs by job, node and/or user.
Example
(job)= "cluster deployment logs") |= "nodename"
(job="compute log messages") |= "nodename" |="node_username"
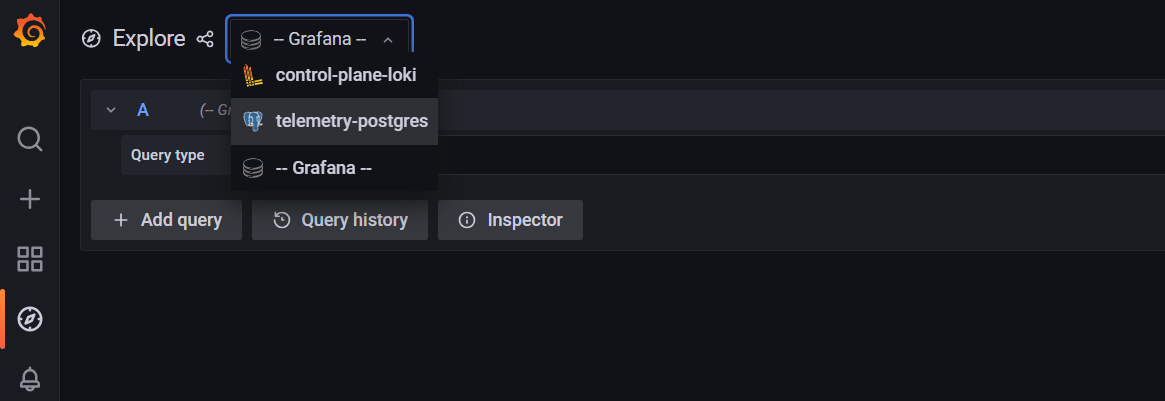
To use Grafana to view telemetry data
Login to the Grafana UI by connecting to the cluster IP of grafana service obtained above via port 5000. That is
http://xx.xx.xx.xx:5000/loginIn the Explore page, select telemetry-postgres.
The query builder allows you to create SQL commands that can be used to query the
omnia_telemetry.metricstable. Filter the data required using the following fields:
id: The name of the metric.
context: The type of metric being collected (Regular Metric, Health Check Metric and GPU metric).
label: A combined field listing the id and context row values.
value: The value of the metric at the given timestamp.
unit: The unit measure of the metric (eg: Seconds, kb, percent, etc.)
system: The service tag of the cluster node.
hostname: The hostname of the cluster node.
time: The timestamp at which the metric was polled from the cluster node.
If you are more comfortable using SQL queries over the query builder, click on Edit SQL to directly provide your query. Optionally, the data returned from a query can be viewed as a graph.
Visualizations
If idrac_telemetry_support and visualisation_support is set to true, Parallel Coordinate graphs can be used to view system statistics.
If you have any feedback about Omnia documentation, please reach out at omnia.readme@dell.com.