Spiral Layout
Spiral Layouts are best for viewing the change in a single metric over time. The spiral organization of node representation can represent a large number (100s to 1000s) of compute nodes in a compact visual. Nodes can be ordered on the spiral by rank per metric value or by metric value. Hovering over a node will display a heatmap of the node metric value over the dataset time-range.
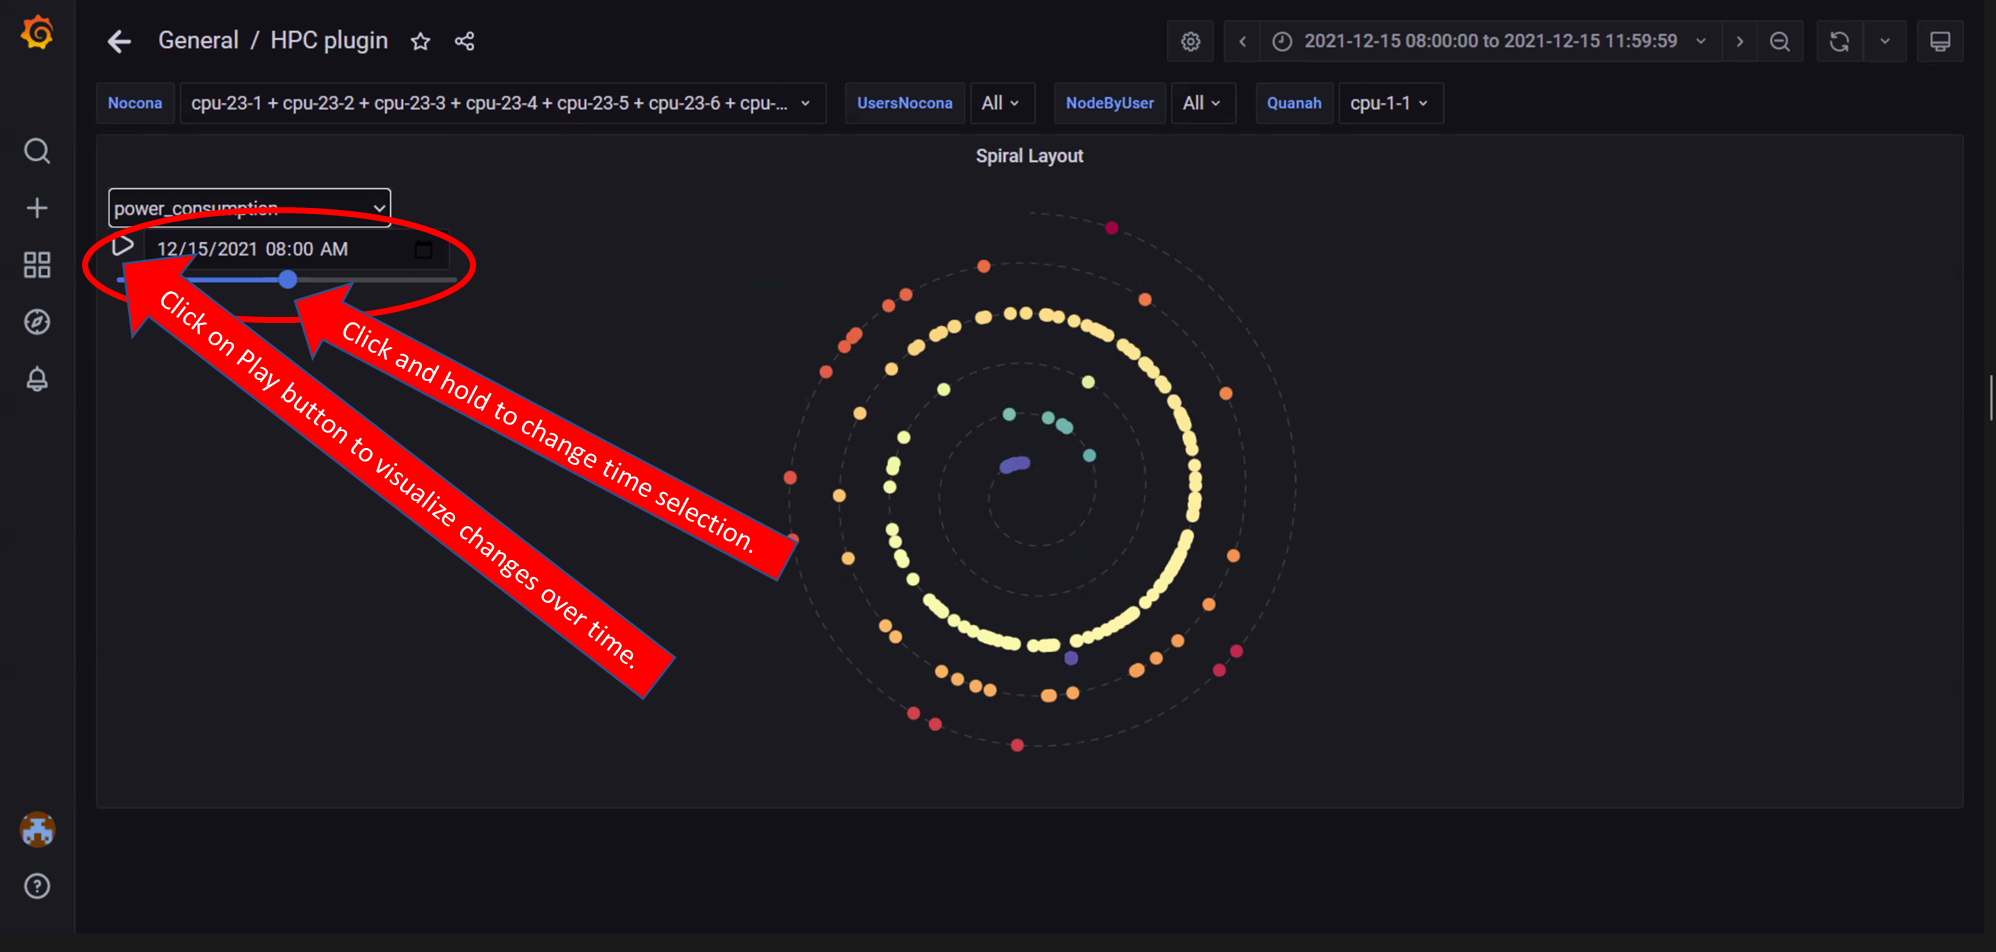 In the above image, the spiral visualization displays compute nodes on a spiral graphing layout. This example orders the compute nodes by Power Consumption at the time indicated by the time range slider.
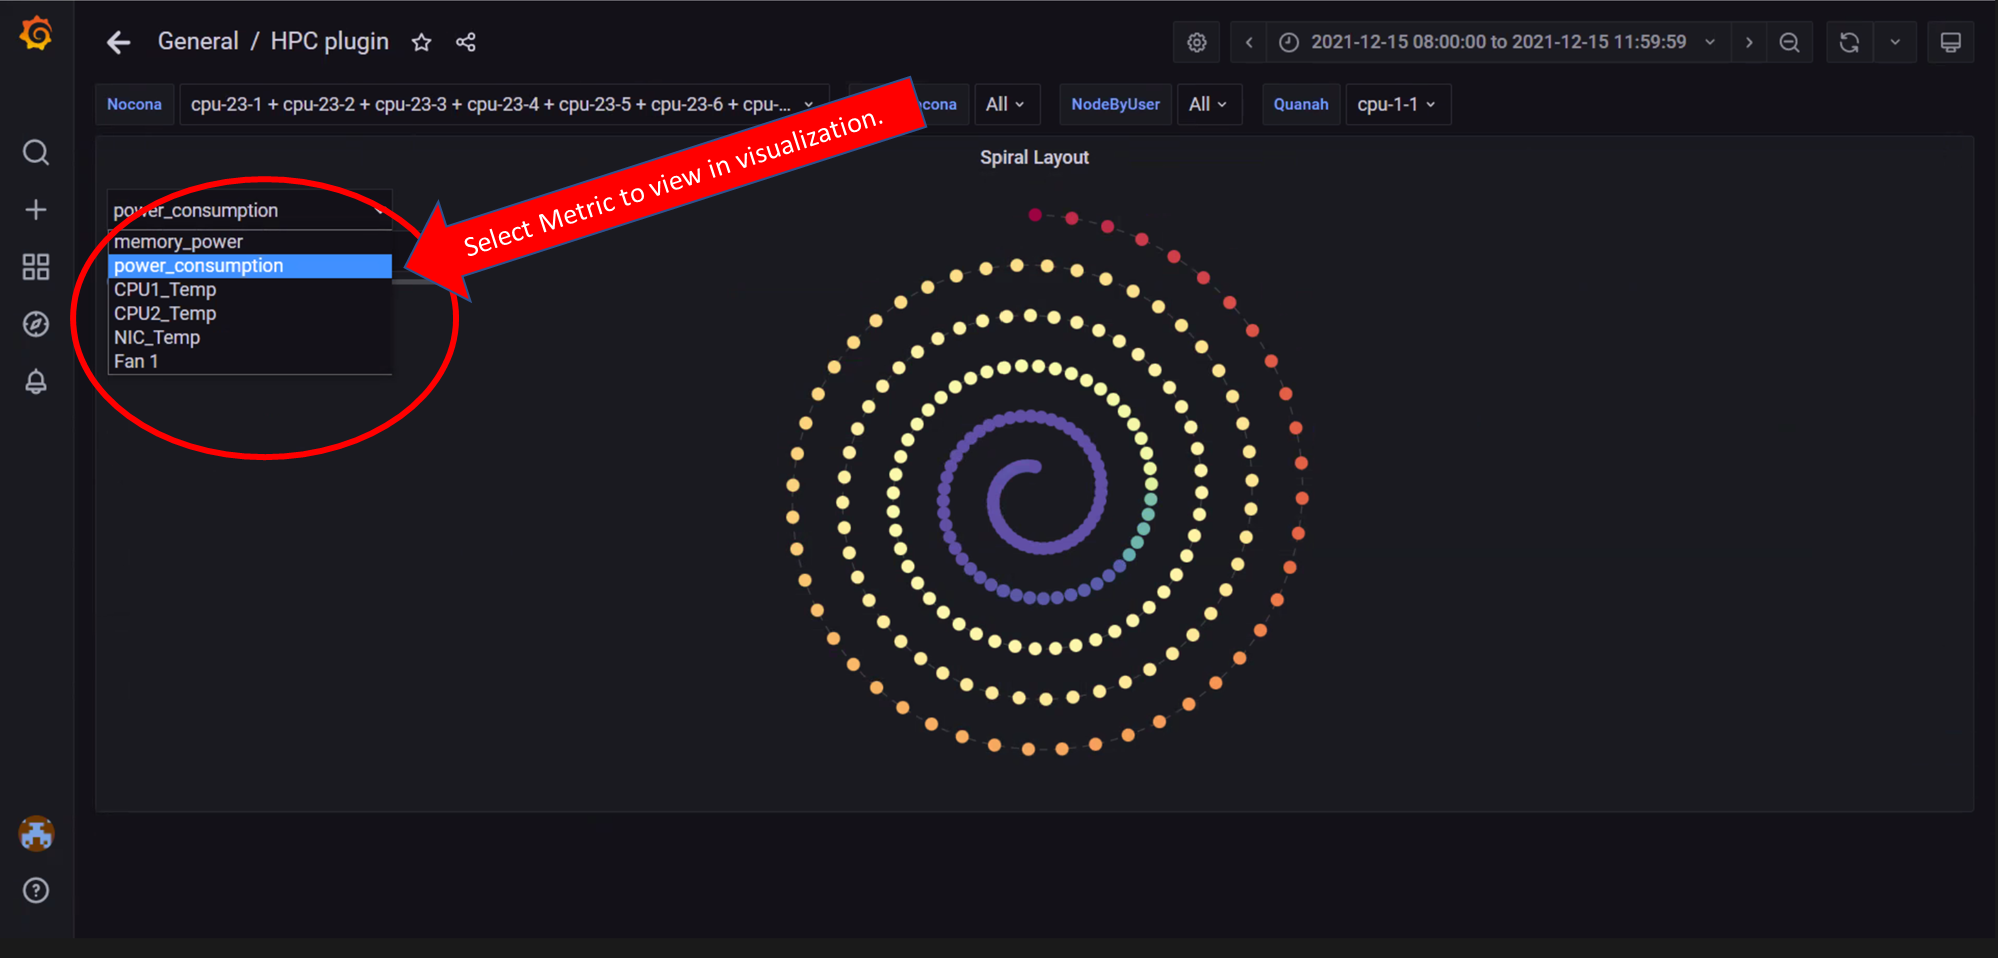 In the above image, all compute nodes are arranged on the spiral graph by their ranking order. The dropdown on the left is used to select what metric is shown.
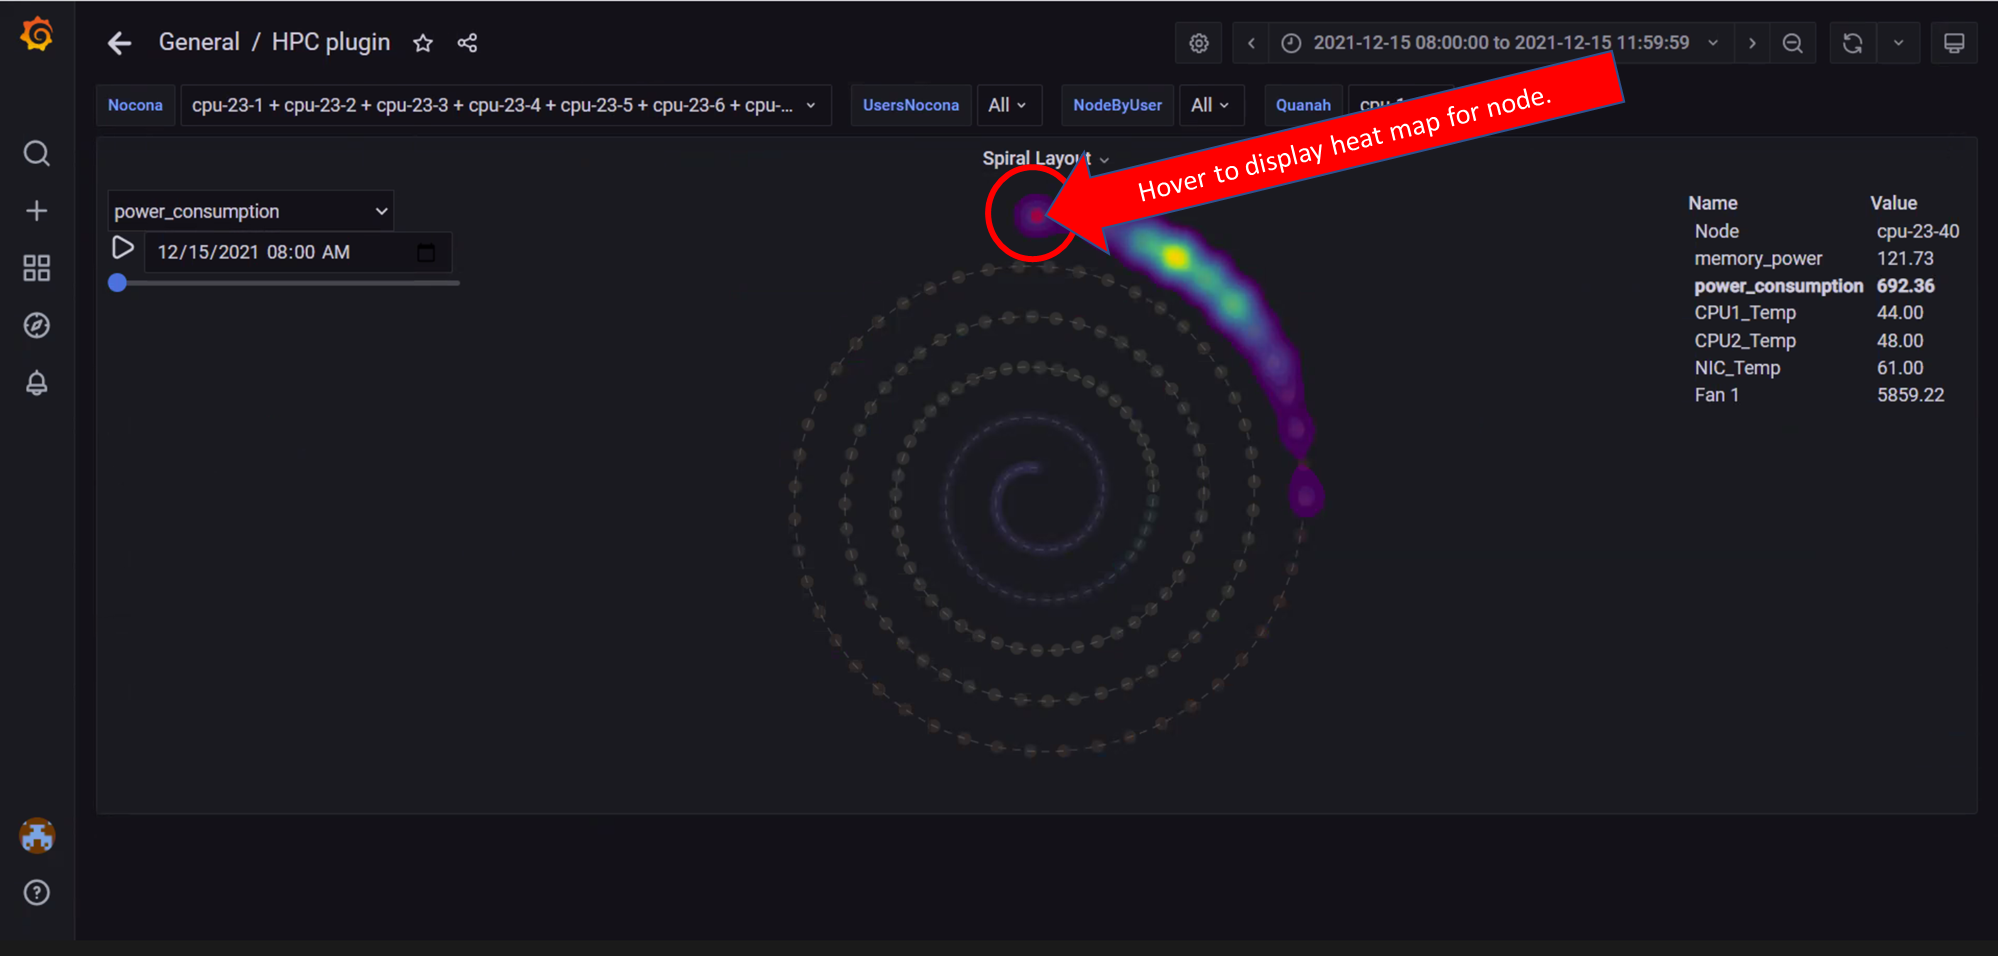 In the above image, a heat map of the metric for that node is displayed for the data set time range selected. Hovering over a node in the graph displays node information on the right. Click on the graph to toggle between freezing and un-freezing the graph.
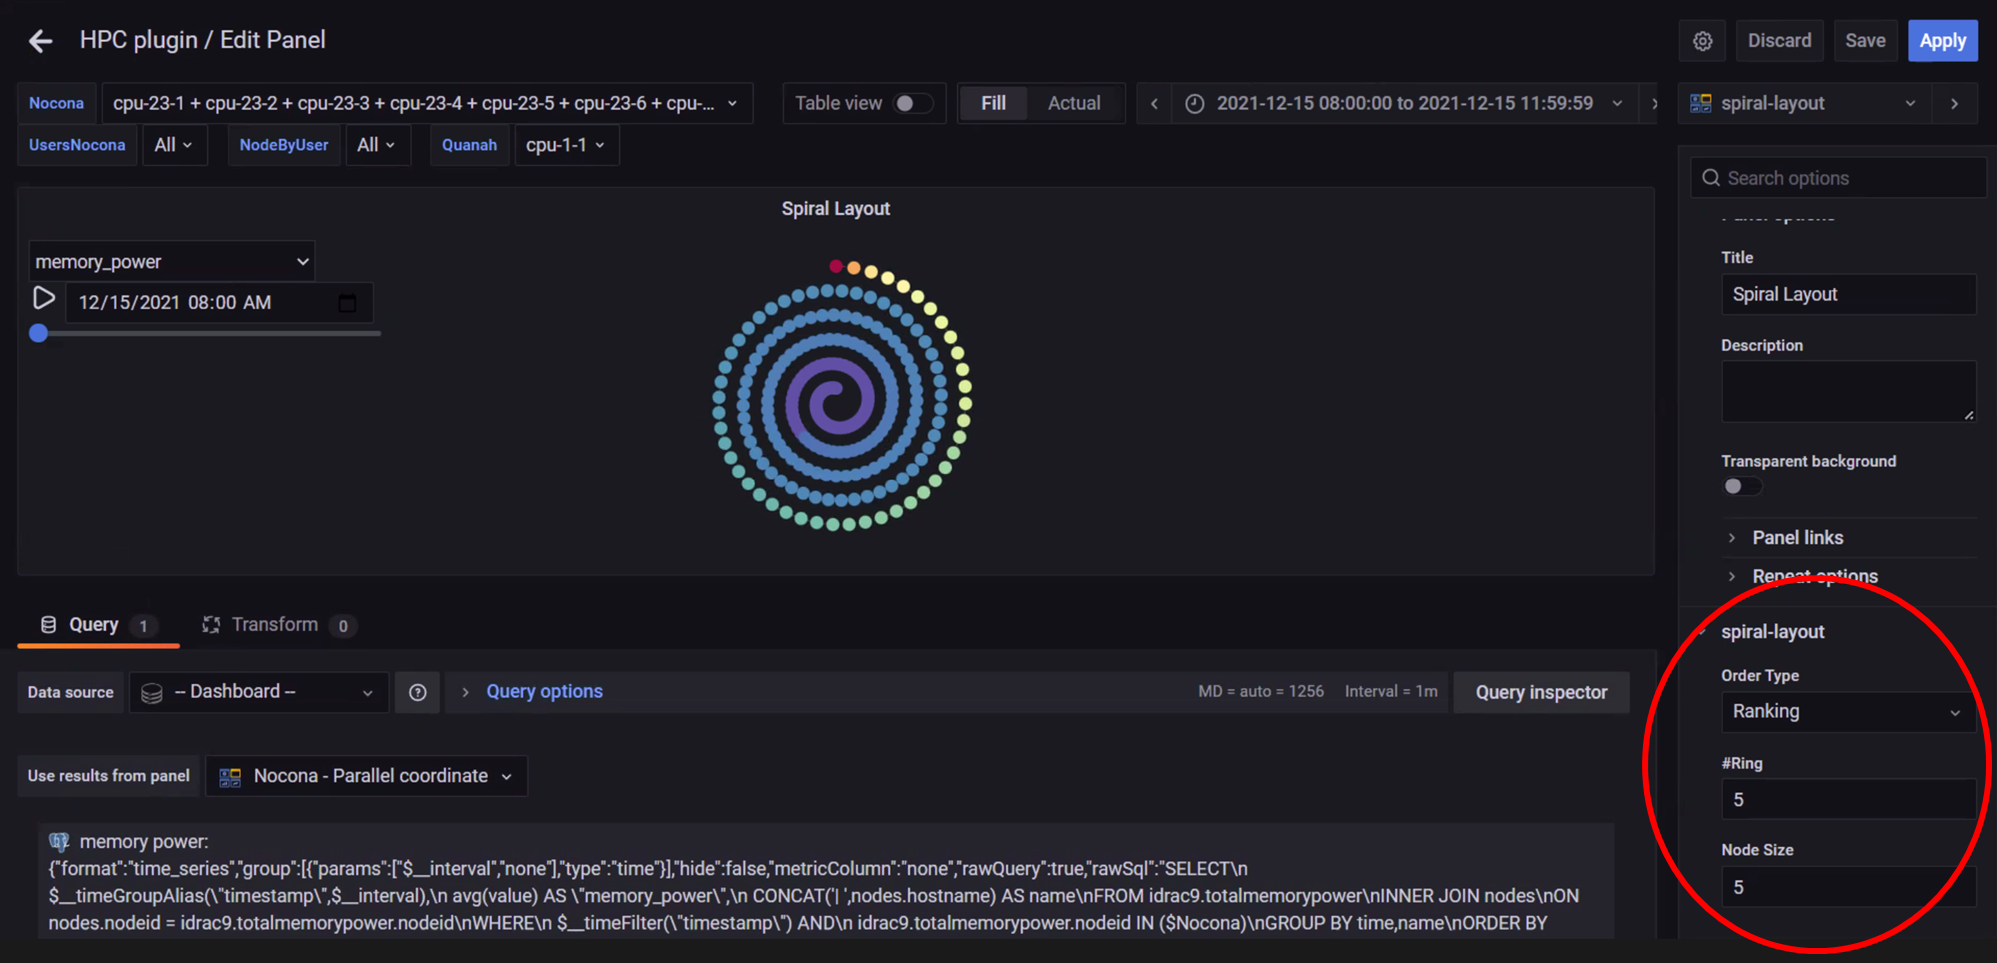 In the above image, behaviour of the Spiral Layout view can be updated using the Edit option from the highlighted dropdown.
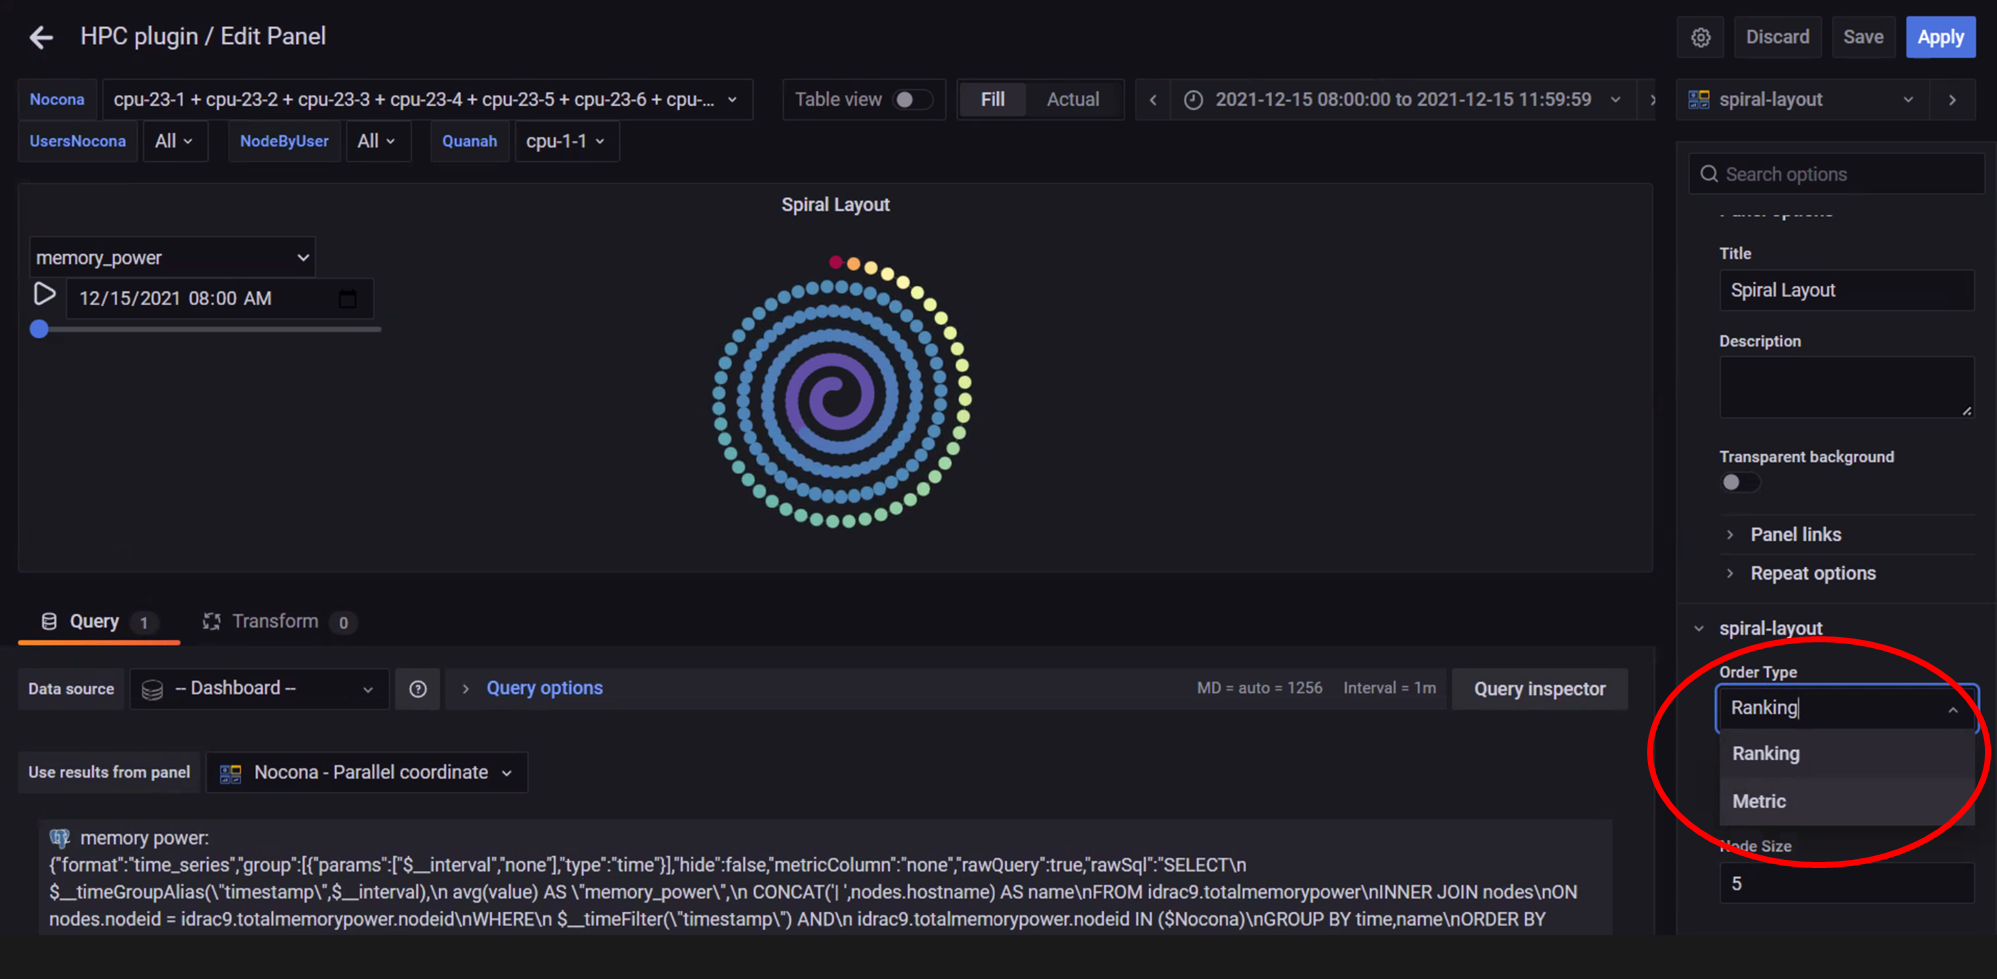 In the above image, the edit panel offers the option to:
* Change the order type
* Change the number of rings displayed
* Change the Node size on the graph
In the above image, the edit panel offers the option to:
* Change the order type
* Change the number of rings displayed
* Change the Node size on the graph
If you have any feedback about Omnia documentation, please reach out at omnia.readme@dell.com.