Monitor
The monitor role sets up Grafana , Prometheus and Loki as Kubernetes pods.
Setting Up Monitoring
To set up monitoring, enter all required variables in
monitor/monitor_config.yml.
Parameter |
Details |
|---|---|
|
Username for Dockerhub account. This will be used for Docker login and a kubernetes secret will be created and patched to service account in default namespace. This kubernetes secret can be used to pull images from private repositories. |
|
Password for Dockerhub account. This field is mandatory if |
|
Kubernetes pod network CIDR for appliance k8s network. Make sure this value does not overlap with any of the host networks.
|
|
The username for grafana UI. The length of username should be at least 5 characters. The username must not contain -,, ‘,” |
|
Password used for grafana UI. The length of the password should be at least 5 characters. The password must not contain -,, ‘,”. Do not use “admin” in this field. |
|
The path where the Grafana persistent volume will be mounted. If telemetry is set up, all telemetry related files will also be stored and both timescale and mysql databases will be mounted to this location. ‘/’ is mandatory at the end of the path.
|
Note
After running
monitor.yml, the fileinput/monitor_config.ymlwill be encrypted. To edit the file, useansible-vault edit monitor_config.yml --vault-password-file .monitor_vault_key.Rocky 8.7 is not compatible with the Kubernetes installed by
monitor.ymldue to known issues with cri-o. For more information, click here.
Run the playbook using the following command:
cd monitor
ansible-playbook monitor.yml
To access the grafana UI:
Find the IP address of the Grafana service using
kubectl get svc -n grafana

Login to the Grafana UI by connecting to the cluster IP of grafana service obtained above via port 5000. That is
http://xx.xx.xx.xx:5000/login
Enter the
grafana_usernameandgrafana_passwordas mentioned inmonitor/monitor_config.yml.
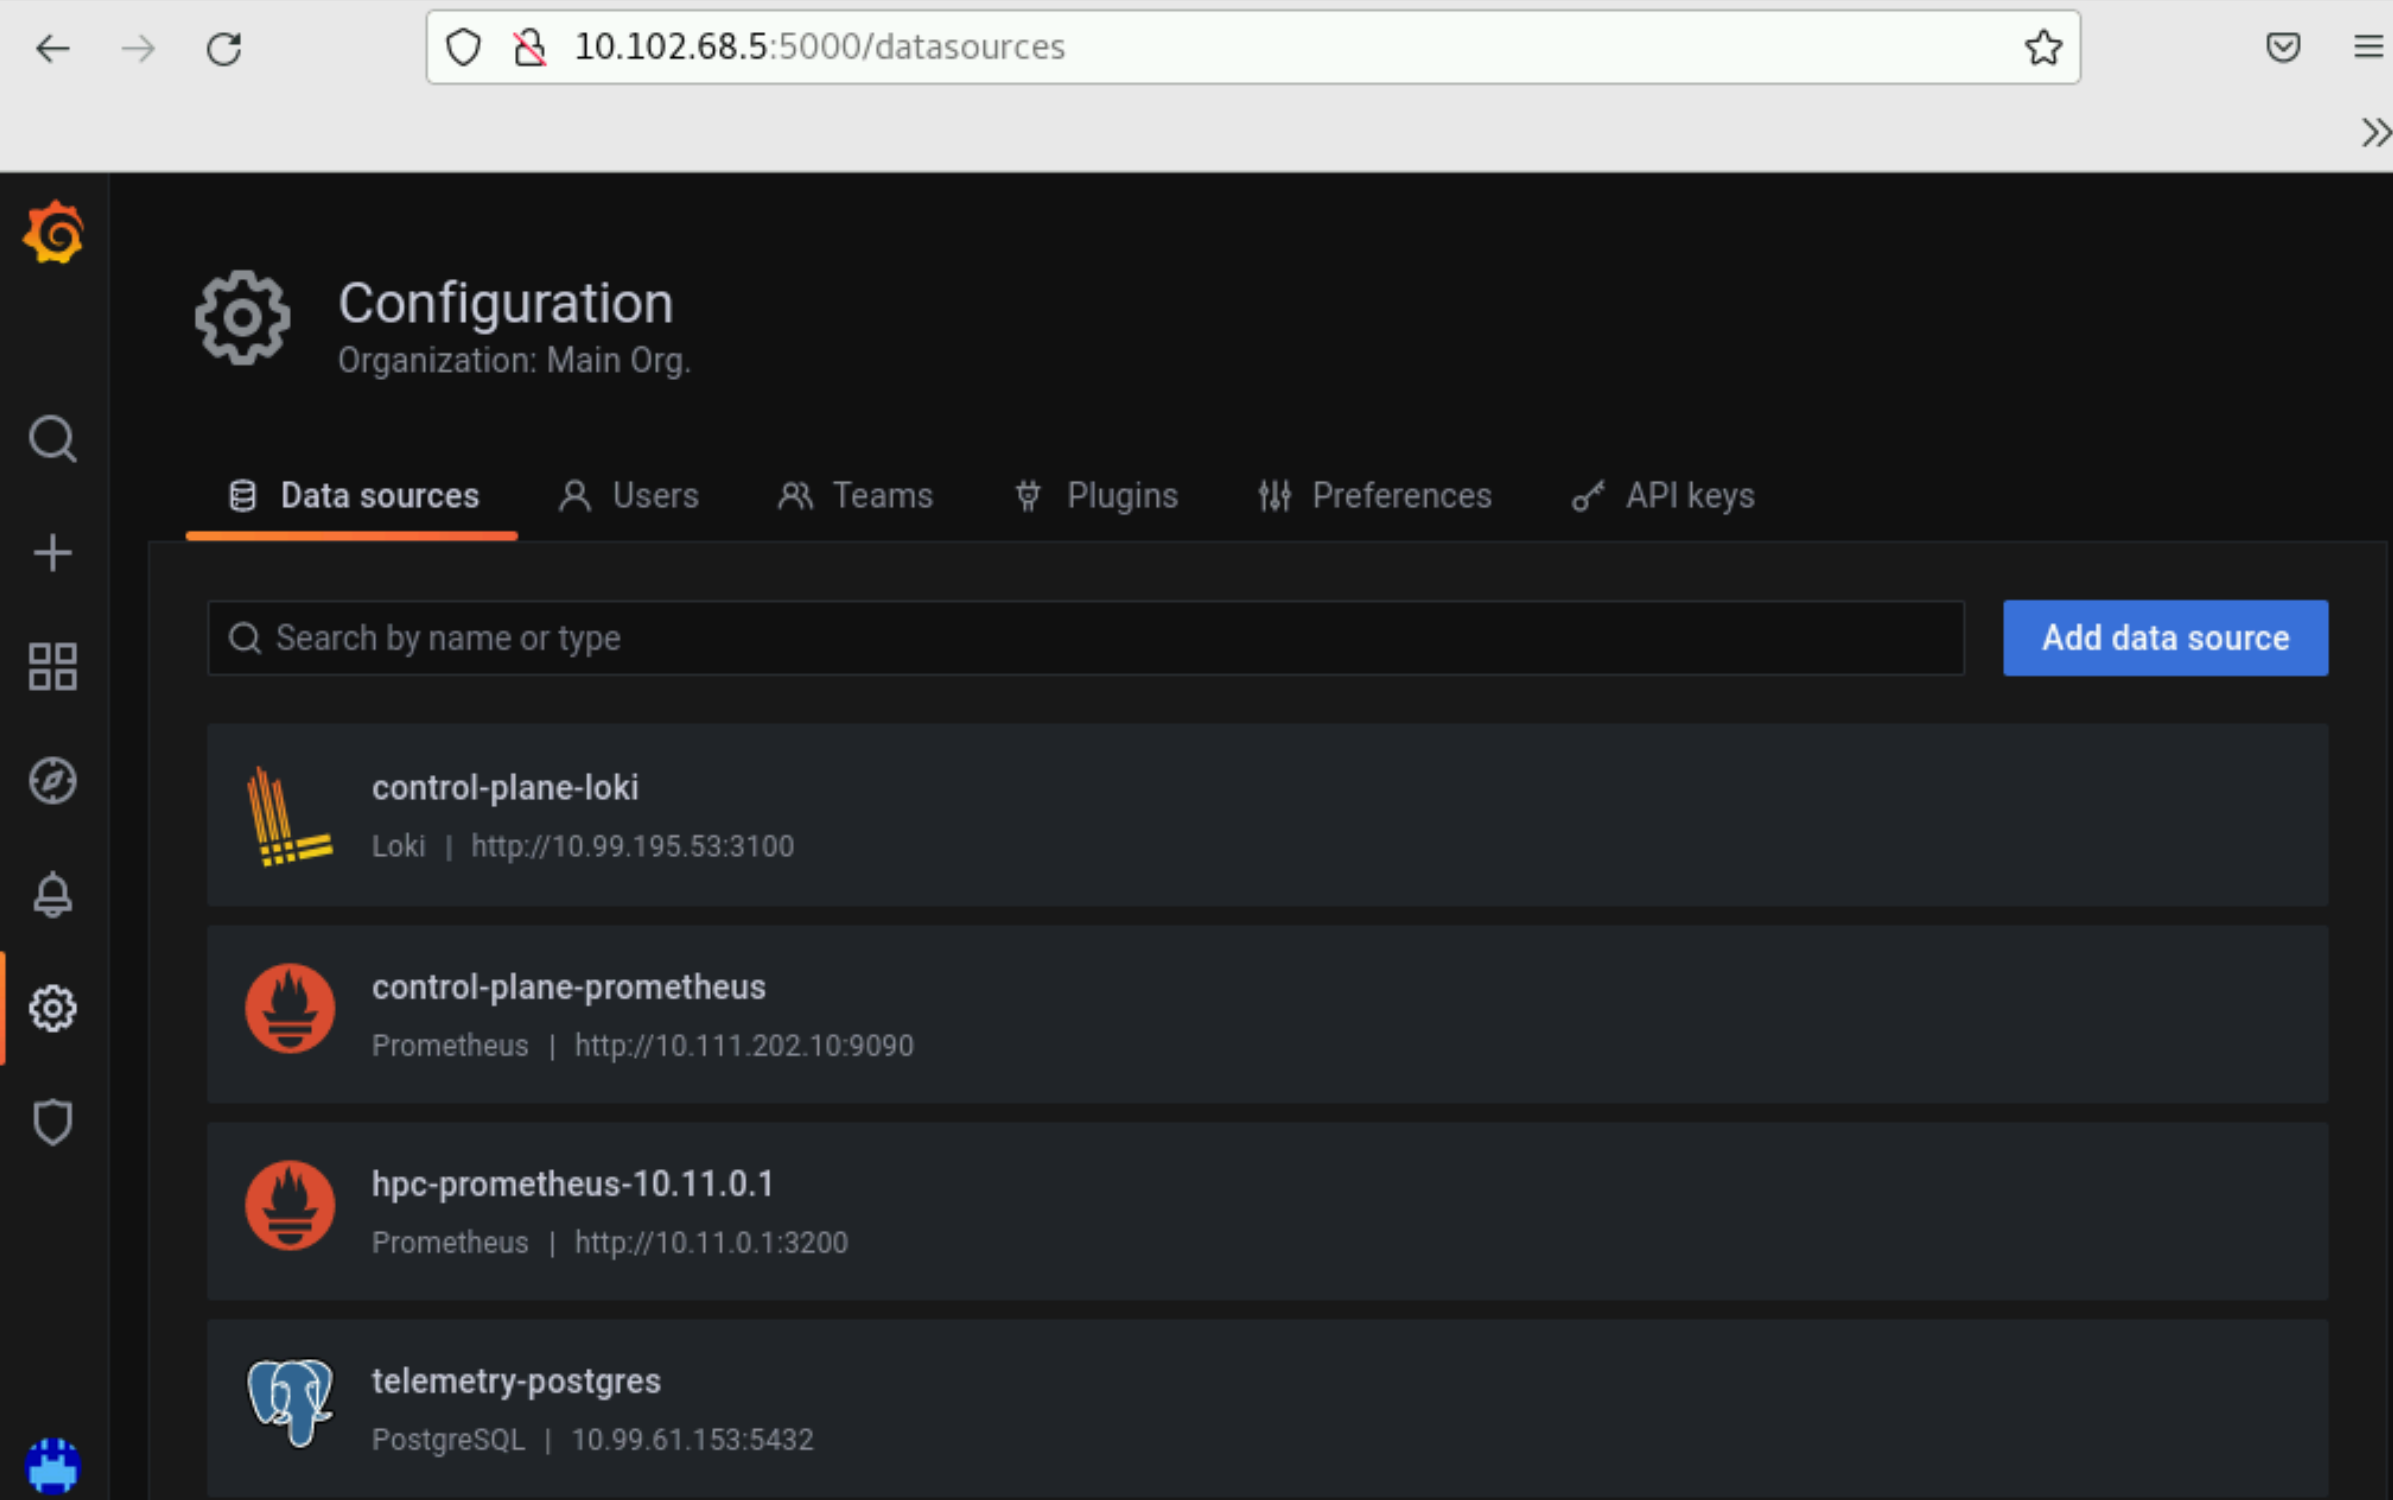
Datasources configured by Omnia can be viewed as seen below.
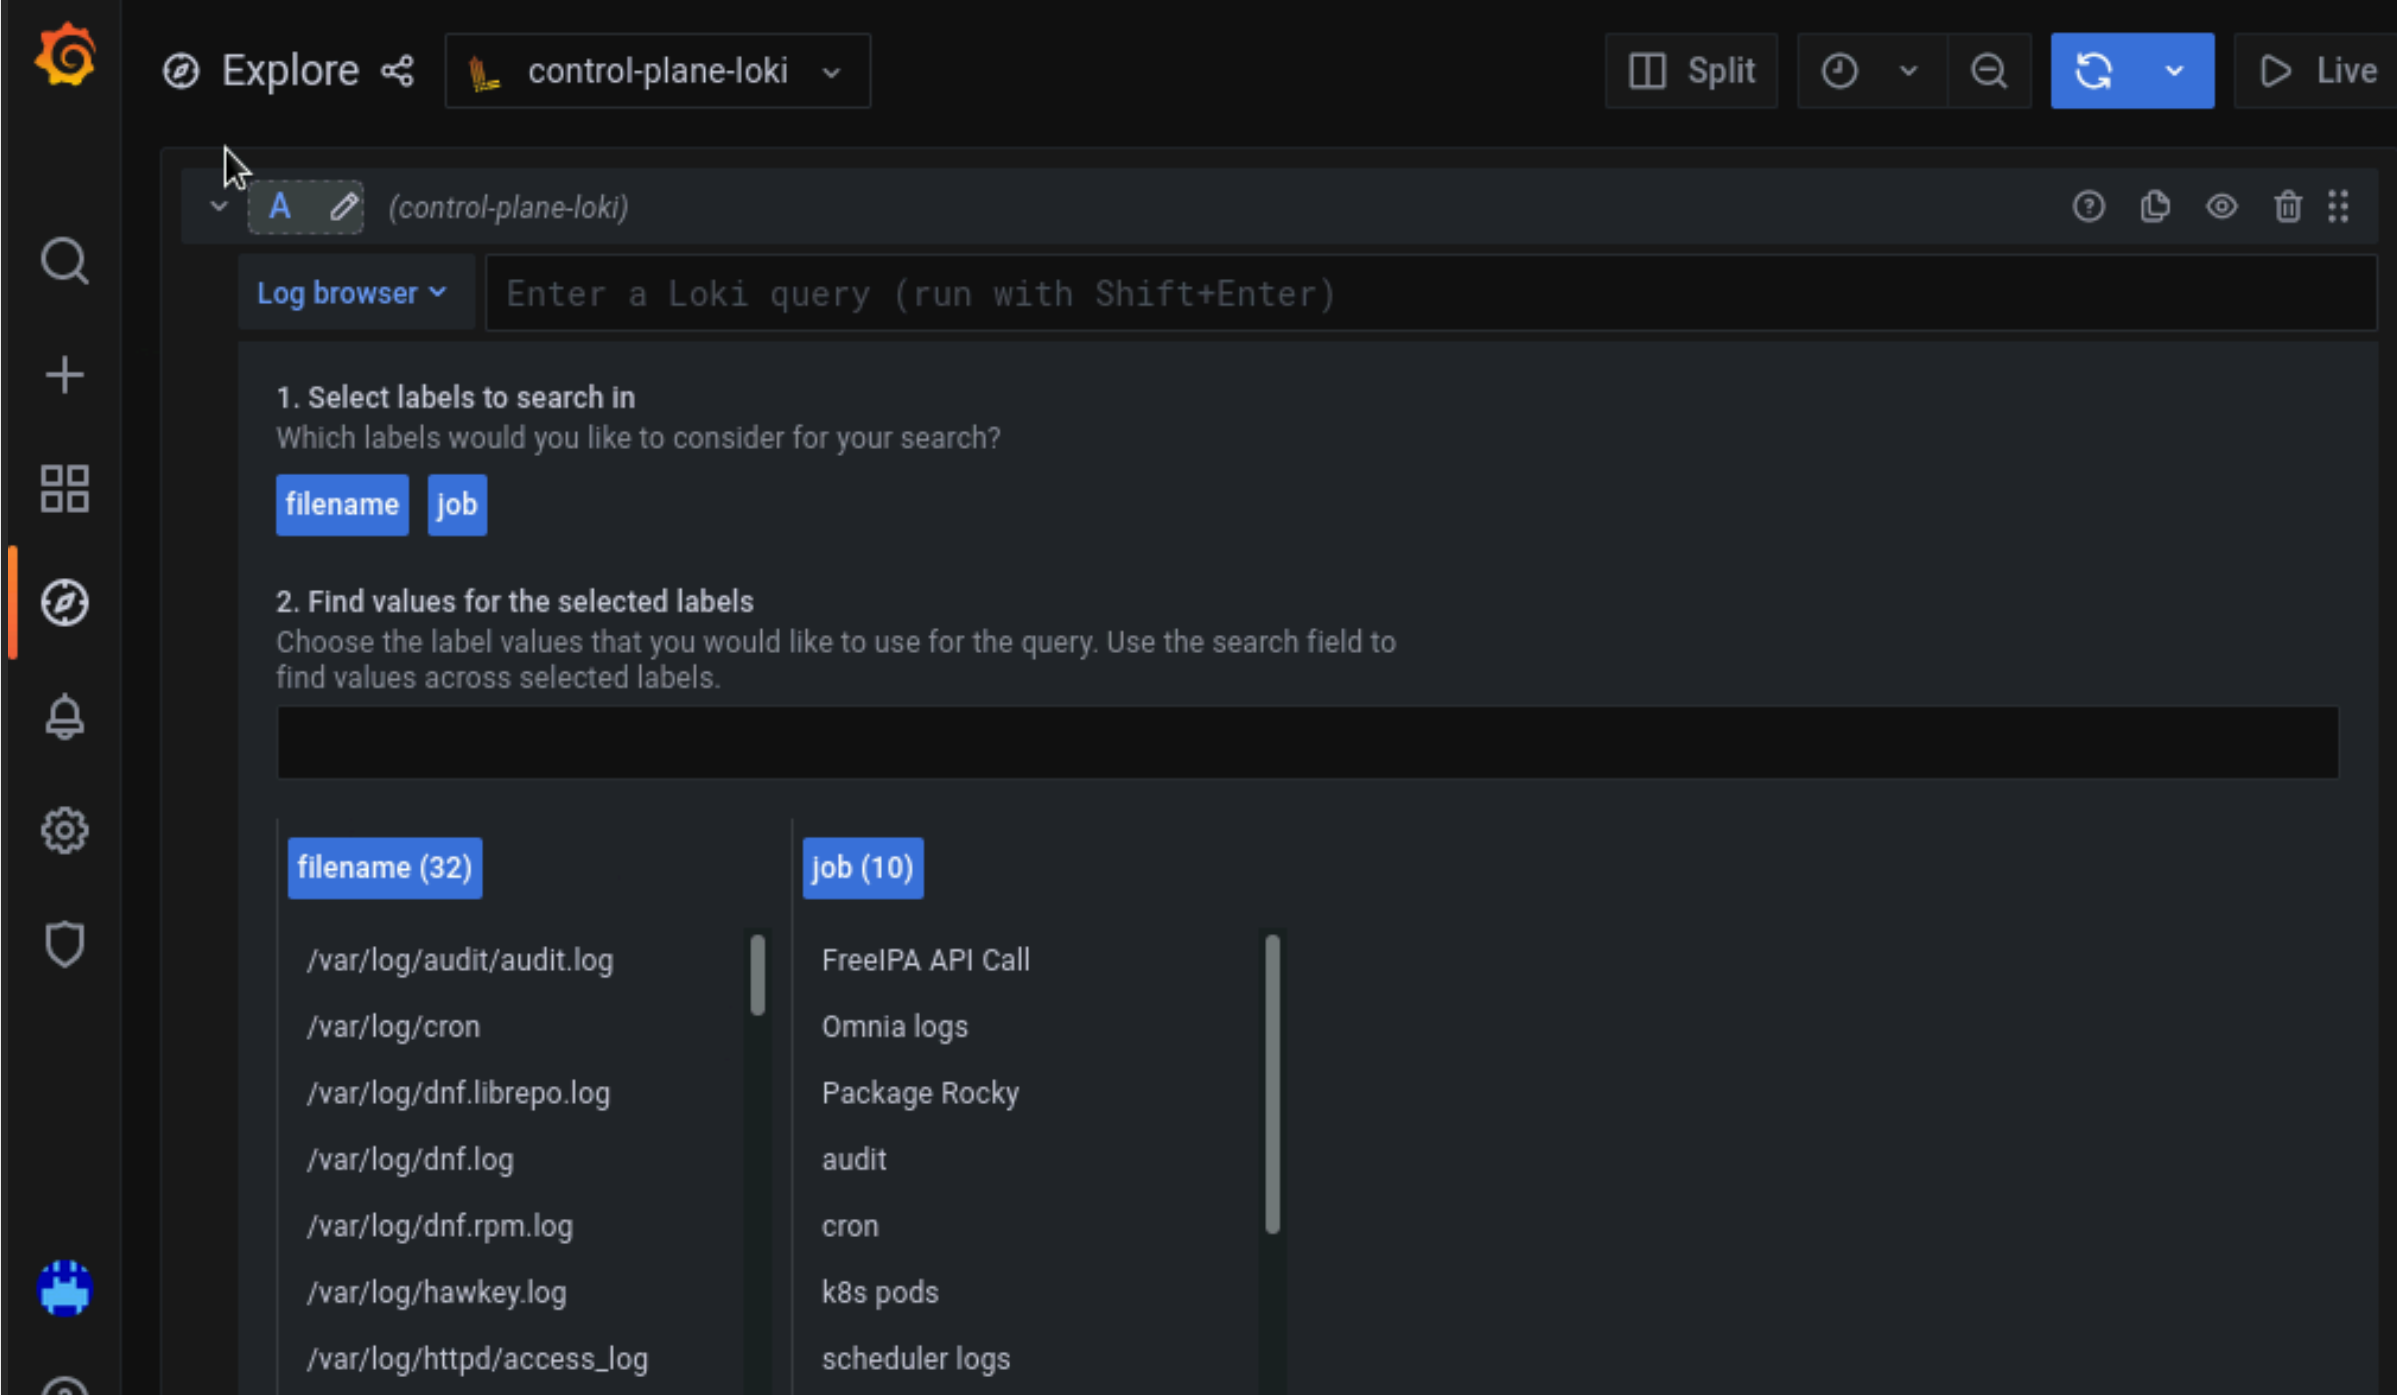
- To use Loki for log filtering
Login to the Grafana UI by connecting to the cluster IP of grafana service obtained above via port 5000. That is
http://xx.xx.xx.xx:5000/login
ii. In the Explore page, select control-plane-loki. .. image:: ../../images/Grafana_ControlPlaneLoki.png iii. The log browser allows users to filter logs by job, node and/or user.
Example
(job= "cluster deployment logs") |= "nodename"
(job="compute log messages") |= "nodename" |="node_username"
If you have any feedback about Omnia documentation, please reach out at omnia.readme@dell.com.